Confirming you are not from the U.S. or the Philippines

By giving this statement, I explicitly declare and confirm that:
  • I am not a U.S. citizen or resident
  • I am not a resident of the Philippines
  • I do not directly or indirectly own more than 10% of shares/voting rights/interest of the U.S. residents and/or do not control U.S. citizens or residents by other means
  • I am not under the direct or indirect ownership of more than 10% of shares/voting rights/interest and/or under the control of U.S. citizen or resident exercised by other means
  • I am not affiliated with U.S. citizens or residents in terms of Section 1504(a) of FATCA
  • I am aware of my liability for making a false declaration.
For the purposes of this statement, all U.S. dependent countries and territories are equalled to the main territory of the USA. I accept full responsibility for the accuracy of this declaration and commit to personally address and resolve any claims or issues that may arise from a breach of this statement.
We are dedicated to your privacy and the security of your personal information. We only collect emails to provide special offers and important information about our products and services. By submitting your email address, you agree to receive such letters from us. If you want to unsubscribe or have any questions or concerns, write to our Customer Support.
Octa trading broker
Open trading account
Back

GBP/USD Price Analysis: Bulls throwing in the towel at weekly resistance

  • GBP/USD is meeting a weekly area of resistance.
  • The bears are engaging as seen on the lower term time frames. 

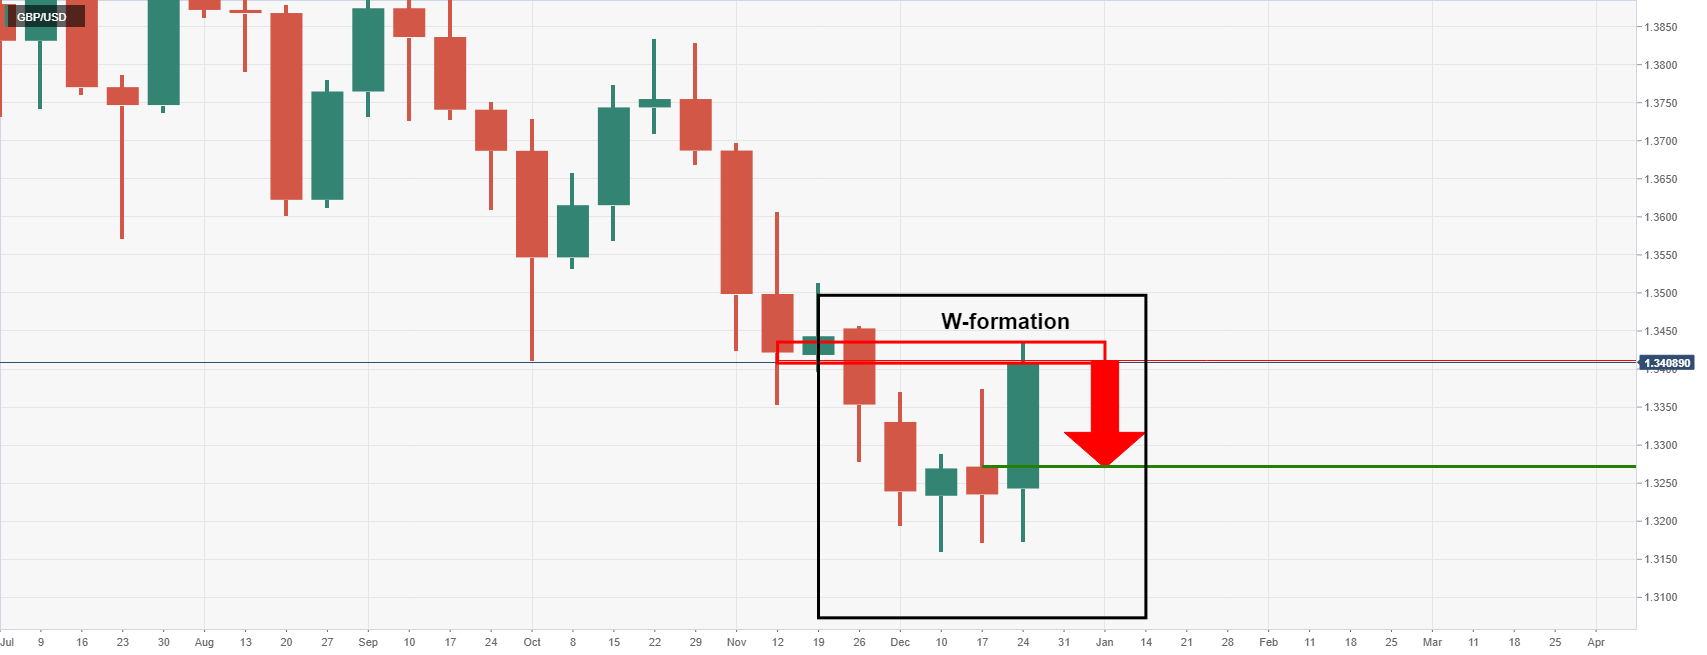
GBP/USD has rallied into a weekly order block from where some meanwhile consolidation would be expected to unfold in the coming sessions. The following illustrates the W-formation that has been left on the weekly chart which is a reversion pattern. The neckline of the W-formation would be expected to be retested. 

GBP/USD weekly chart
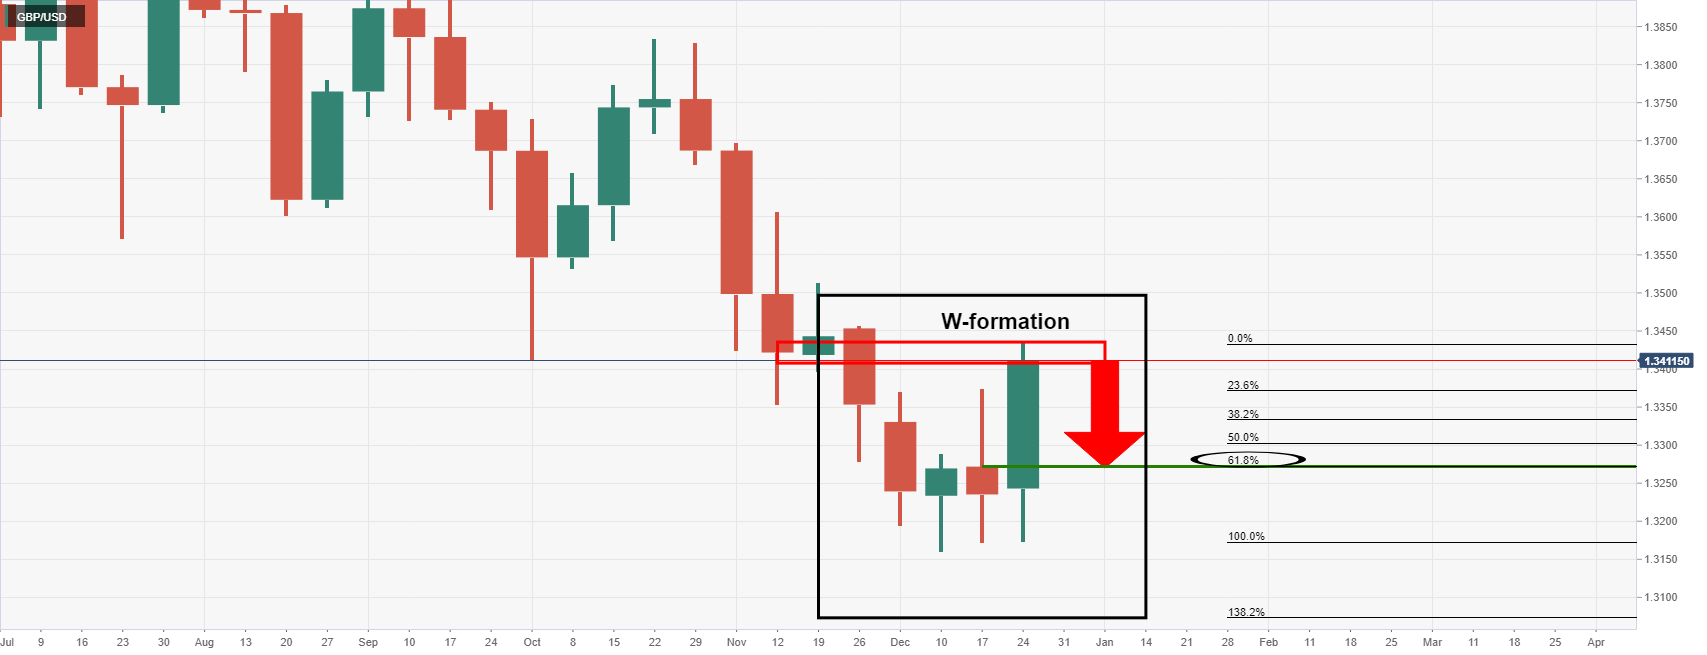
Drawing the Fibonaccis and measuring the bullish impulse, the 61.8% Fibo aligns with the neckline which offers a confluence for which traders will note: 
GBP/USD daily chart
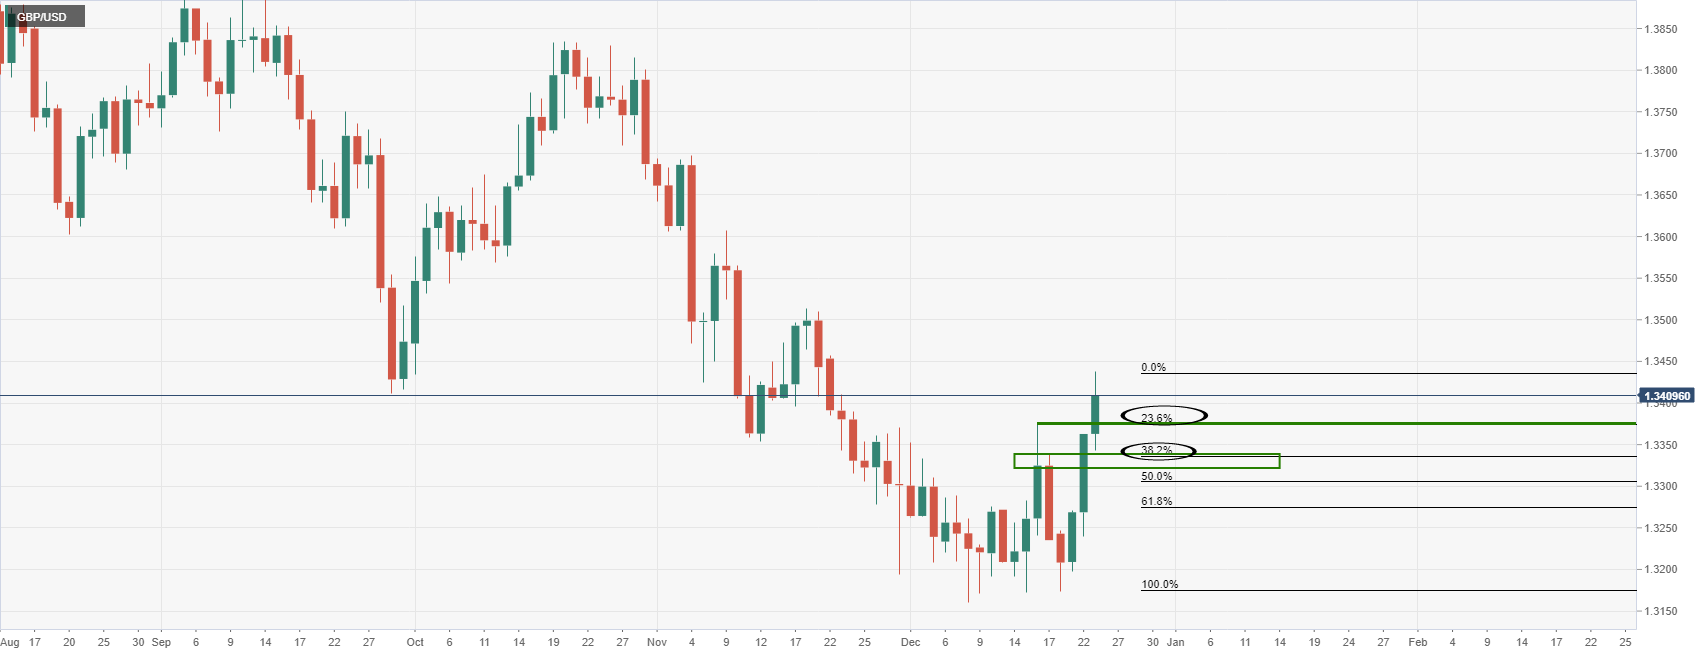
The price on the daily chart, however, provides a structure that would be expected to act as support higher up the Fibo scale. For instance, there is a bullish spike, the true top of the W-formation's neckline, located at 1.3375. This aligns with the 23.6% Fibo. Lower, the next level of resistance 1.3320/35 aligns near to the 38.2% Fibo and structure, as illustrated above. 

GBP/USD H1 chart
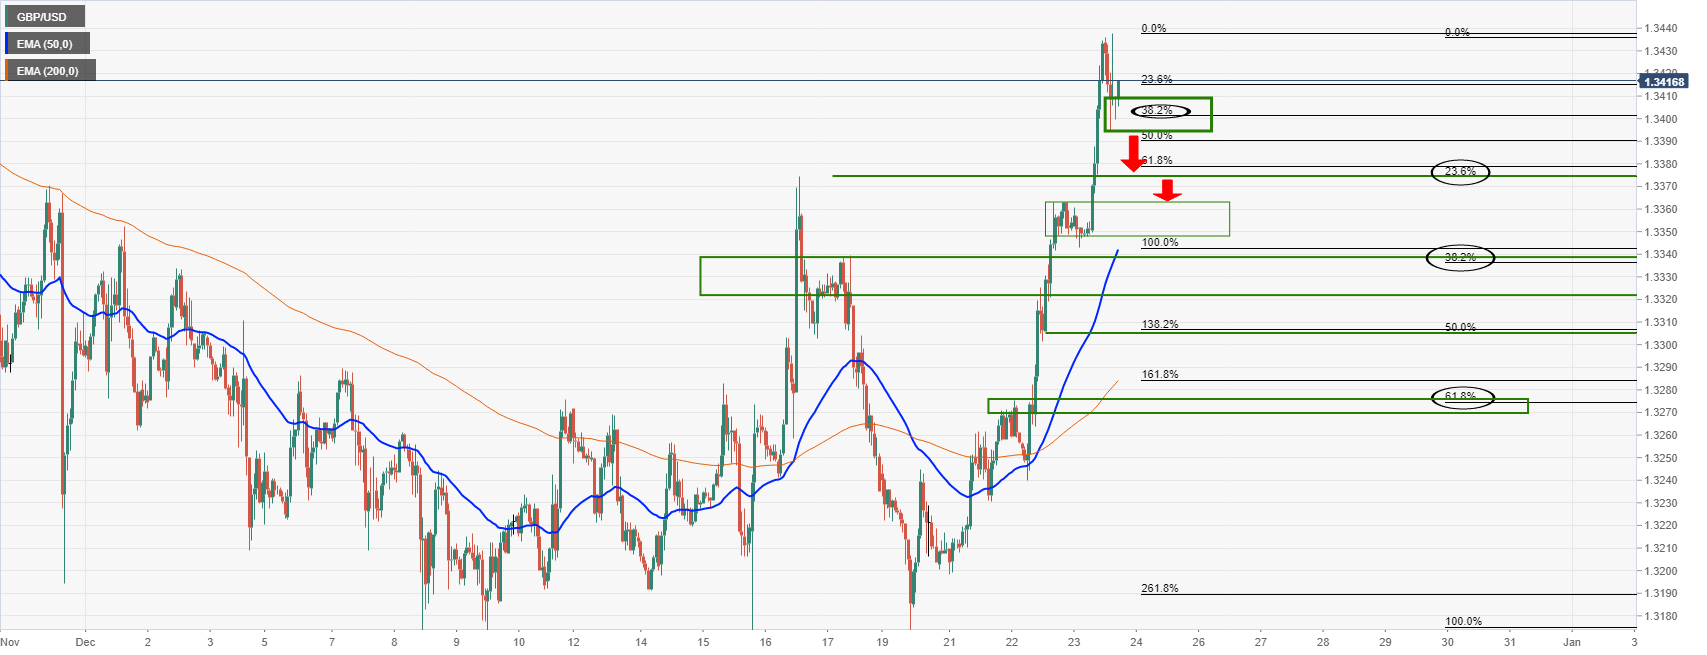
The hourly chart is full of various structures on the downside. In regular market conditions, these areas would be expected to act as support on the way to a test of the 50-EMA or on towards the 200-EMA, both of which align with the weekly chart's W-formation's structure and the daily chart's supports. 

USD/JPY extends its three-day gains, steady at around 114.30s

The US dollar extends its rally against the Japanese yen, advances for the third consecutive day, trading at 114.36 during the New York session at pre
Read more Previous

USD/CHF Price Analysis: Struggles at the confluence of the 50 and the 100-DMA, bears eye the 200-DMA

The USD/CHF fall continues for the second consecutive day, trading at 0.9177 during the New York session at the time of writing. The Santa Rally arriv
Read more Next