Confirming you are not from the U.S. or the Philippines

By giving this statement, I explicitly declare and confirm that:
  • I am not a U.S. citizen or resident
  • I am not a resident of the Philippines
  • I do not directly or indirectly own more than 10% of shares/voting rights/interest of the U.S. residents and/or do not control U.S. citizens or residents by other means
  • I am not under the direct or indirect ownership of more than 10% of shares/voting rights/interest and/or under the control of U.S. citizen or resident exercised by other means
  • I am not affiliated with U.S. citizens or residents in terms of Section 1504(a) of FATCA
  • I am aware of my liability for making a false declaration.
For the purposes of this statement, all U.S. dependent countries and territories are equalled to the main territory of the USA. I accept full responsibility for the accuracy of this declaration and commit to personally address and resolve any claims or issues that may arise from a breach of this statement.
We are dedicated to your privacy and the security of your personal information. We only collect emails to provide special offers and important information about our products and services. By submitting your email address, you agree to receive such letters from us. If you want to unsubscribe or have any questions or concerns, write to our Customer Support.
Octa trading broker
Open trading account
Back

WTI Price Analysis: 50/100-HMA confluence guards immediate upside

  • WTI prints mild losses while declining below $48.00.
  • Receding MACD histogram, strong upside hurdle challenge bulls.
  • Two-week-old horizontal support restricts short-term declines, buyers can remain hopeful beyond August top.

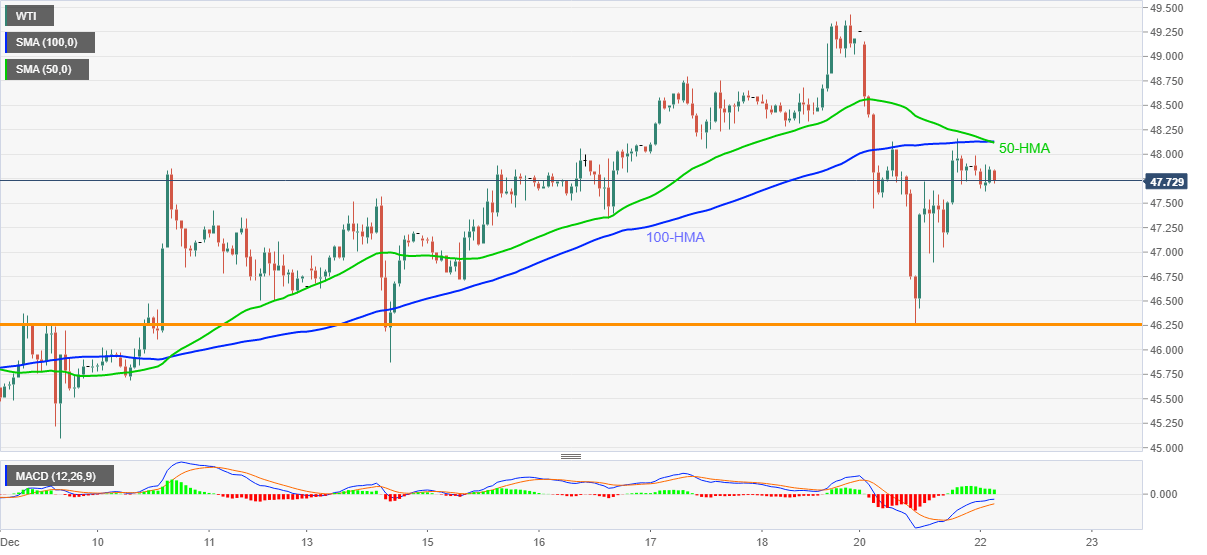
WTI eases to $47.79, down 0.10% intraday, during early Tuesday. The energy benchmark posted the biggest daily losses in six weeks the previous day. Though, a horizontal line comprising multiple levels since December 09 restricted further downside.

It should, however, be noted that the corrective recovery beyond the stated support line fails to cross a confluence of 50 and 100-HMAs. The receding upside momentum also takes clues from the MACD histogram, which in turn suggests the immediate weakness of the black gold.

As a result, the $47.00 threshold can lure the oil sellers ahead of directing them to the aforementioned support near $46.25. Though, any further weakness will not hesitate to challenge the monthly low near $44.00.

However, WTI buyers are likely to remain hopeful unless witnessing a daily closing below August month’s top near $43.85.

On the contrary, a clear break above the SMA convergence near $48.15 will quickly challenge the multi-month peak, marked last Friday, near $49.45.

Overall, the energy prices are in an uptrend that eyes the $50.00 threshold.

WTI hourly chart
Trend: Bullish


Gold Price Analysis: XAU/USD battles 50-HMA on the road to recovery

Gold (XAU/USD) witnessed good two-way businesses on Monday, as traders danced to the tune of the optimism on the agreement of a US stimulus deal in th
Read more Previous

Asian Stock Market: Pressured over covid variant as US Congress ready the stimulus

Asian equities stay depressed during early Tuesday as the coronavirus (COVID-19) variant renews fears of another pandemic even as global vaccine manuf
Read more Next