WTI Price Analysis: Extends API-led gains to one-week high around mid-$41.00s
- WTI remains on the front foot near $41.55, the highest levels since October 09.
- US API Weekly Crude Oil Stock slumped from 0.951M to -5.42M.
- Overbought RSI conditions join one-month-old resistance line to challenge the bulls.
- Two-week-long ascending trend line, confluence of 100/200-bar SMA stop the bears.
WTI seesaws around one week high of $41.56 during the early Thursday morning in Asia. In doing so, the black gold respect upbeat oil inventory data from the American Petroleum Institute (API) for the week ended on October 09 while challenging the one-week high. However, RSI conditions and nearness to the key resistance line seem to tease the counter-trend-traders’ entry.
As a result, the oil benchmark may revisit 61.8% Fibonacci retracement of August-September downside, near $41.00, during the fresh pullback moves. Though, any further weakness will be tamed by an ascending trend line from October 02, currently around $40.20.
In a case where the WTI prices remain weak below $40.20, the $40.00 round-figure and the joint of the key SMAs, currently around $39.90/80, will be challenging the sellers.
Alternatively, a falling trend line from September 18, at $41.67 now, becomes the immediate resistance to watch ahead of the early-September top close to $42.10.
During the quote’s extra strength past-$42.1, the August 27 low near $42.50 and the $43.00 threshold may act as buffers before challenging the August month’s peak surrounding $43.85.
WTI four-hour chart
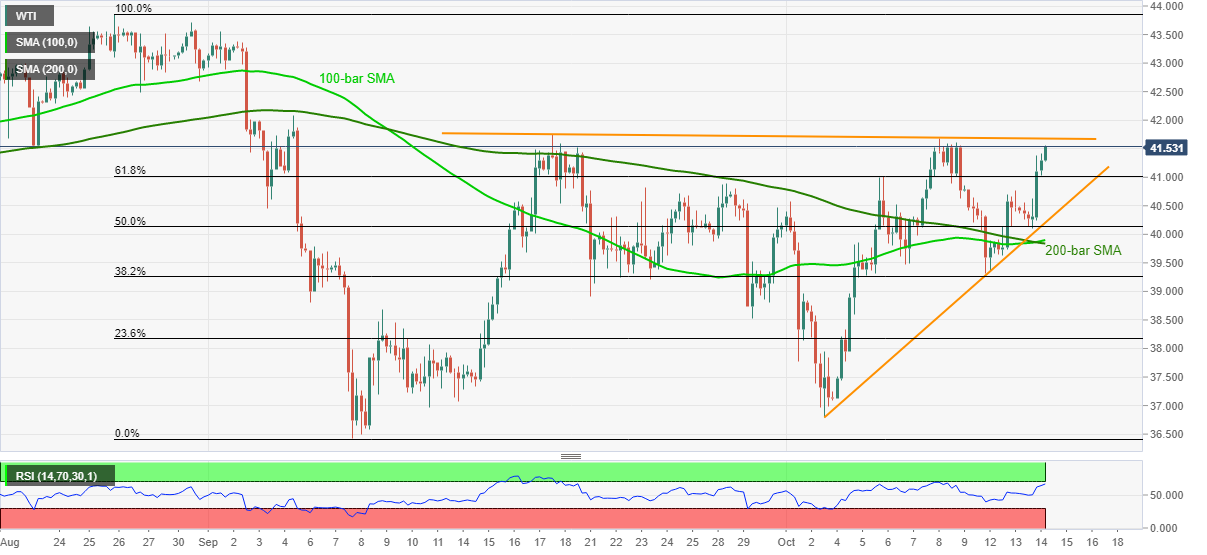
Trend: Pullback expected