Confirming you are not from the U.S. or the Philippines

By giving this statement, I explicitly declare and confirm that:
  • I am not a U.S. citizen or resident
  • I am not a resident of the Philippines
  • I do not directly or indirectly own more than 10% of shares/voting rights/interest of the U.S. residents and/or do not control U.S. citizens or residents by other means
  • I am not under the direct or indirect ownership of more than 10% of shares/voting rights/interest and/or under the control of U.S. citizen or resident exercised by other means
  • I am not affiliated with U.S. citizens or residents in terms of Section 1504(a) of FATCA
  • I am aware of my liability for making a false declaration.
For the purposes of this statement, all U.S. dependent countries and territories are equalled to the main territory of the USA. I accept full responsibility for the accuracy of this declaration and commit to personally address and resolve any claims or issues that may arise from a breach of this statement.
We are dedicated to your privacy and the security of your personal information. We only collect emails to provide special offers and important information about our products and services. By submitting your email address, you agree to receive such letters from us. If you want to unsubscribe or have any questions or concerns, write to our Customer Support.
Octa trading broker
Open trading account
Back

USD/INR Price News: Indian rupee buyers await confirmation of bearish flag

  • USD/INR pick-up bids from 73.30, defies the previous day’s halt to two-day winning streak.
  • A bearish chart formation joins downbeat signals from MACD to keep pair sellers hopeful.
  • The key SMAs add to the upside barriers other than the flag’s resistance.

USD/INR prints 0.23% intraday gains, at 73.47 now, while traders from India brush their screens for Thursday’s move. Even so, a bearish flag formation on the four-hour (4H) chart joins MACD signals to favor the sellers that dominated for the first time in a week on Wednesday.

As a result, the pair traders closely await a downside break of 73.15 to confirm the pattern suggesting a heavy downside toward the yearly low of 70.46.

However, the monthly bottom surrounding 72.75 and September 2019 top of 72.37, followed by January month’s high of 72.22, can offer intermediate stops during the anticipated slump.

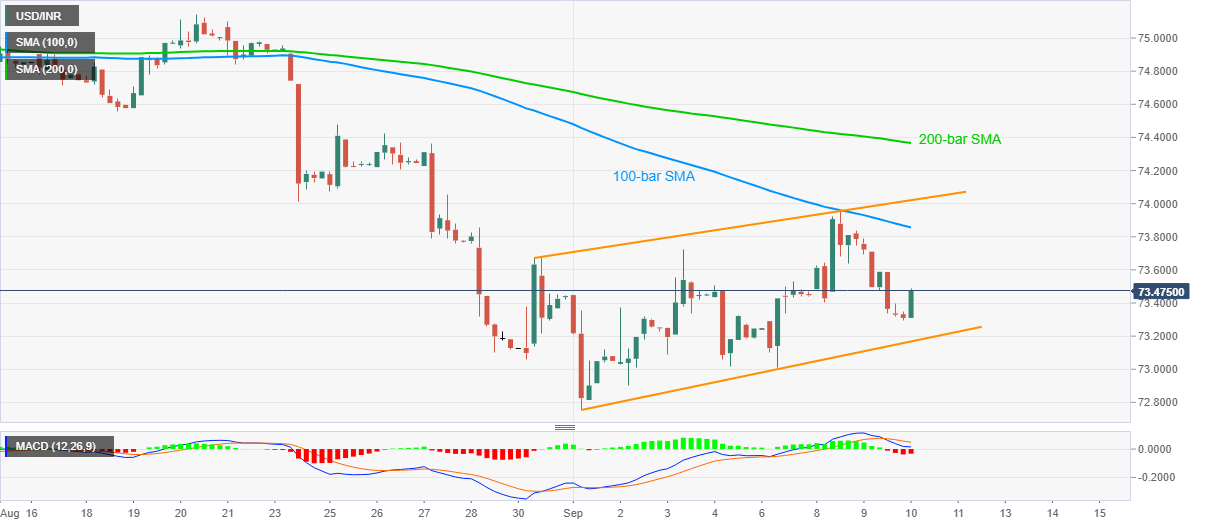
If at all the bulls keep the reins, 73.70 and 100-bar SMA level of 73.85 can question the immediate run-up before the upper line of the flag, at 74.00 now.

Even if the quote manages to cross 74.00, the bulls are likely to be challenged by a 200-bar SMA level of 74.36 before highlighting the 75.00 threshold for the buyers.

USD/INR four-hour chart

Trend: Bearish


Stalled global economic recovery fuels fresh buildup of oil inventory

Major oil traders like Trafigura, Vitol, Litasco, and Glencore are again booking tankers to store millions of barrels of crude oil and refined fuels a
Read more Previous

WTI Price Analysis: Hourly RSI shows corrective bounce has ended

West Texas Intermediate (WTI) crude is currently trading near $37.80, representing a 0.7% decline on the day. The hourly chart relative strength index
Read more Next