Confirming you are not from the U.S. or the Philippines

By giving this statement, I explicitly declare and confirm that:
  • I am not a U.S. citizen or resident
  • I am not a resident of the Philippines
  • I do not directly or indirectly own more than 10% of shares/voting rights/interest of the U.S. residents and/or do not control U.S. citizens or residents by other means
  • I am not under the direct or indirect ownership of more than 10% of shares/voting rights/interest and/or under the control of U.S. citizen or resident exercised by other means
  • I am not affiliated with U.S. citizens or residents in terms of Section 1504(a) of FATCA
  • I am aware of my liability for making a false declaration.
For the purposes of this statement, all U.S. dependent countries and territories are equalled to the main territory of the USA. I accept full responsibility for the accuracy of this declaration and commit to personally address and resolve any claims or issues that may arise from a breach of this statement.
We are dedicated to your privacy and the security of your personal information. We only collect emails to provide special offers and important information about our products and services. By submitting your email address, you agree to receive such letters from us. If you want to unsubscribe or have any questions or concerns, write to our Customer Support.
Octa trading broker
Open trading account
Back

Analisa Harga USD/JPY: Tinggalkan Terendah Intraday Tapi Penjual Tetap Berharap Di 106,00

  • USD/JPY memangkas penurunan di awal hari dengan memantul dari 105,72.
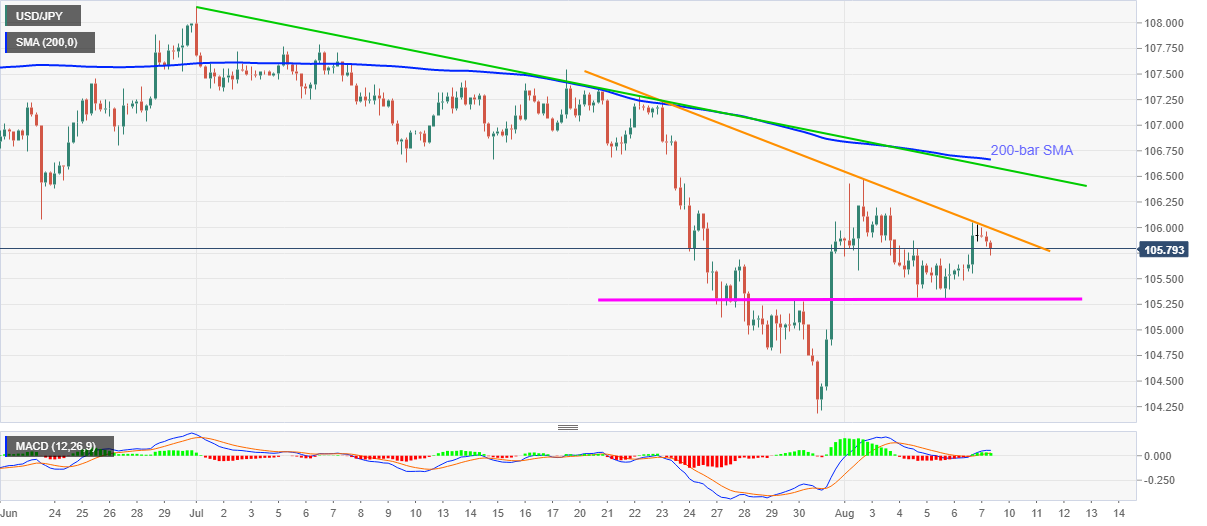
  • Garis resistensi 12-hari mempertahankan penjual, garis tren penurunan bulanan dan SMA 200-bar menambah hambatan sisi atas.
  • Support horizontal jangka pendek dapat dapat menjadi resistensi terdekat.

USD/JPY naik ke 105,79 selama jam-jam awal perdagangan hari ini. Meski begitu, turun 0,12% hari ini sementara menentang penghentian hari Jumat untuk penurunan tiga hari berturut-turut.

Meskipun MACD menunjukkan sinyal bullish, kenaikan jangka dekat pasangan ini ditantang oleh garis tren turun dari 23 Juli, di 106,00 sekarang, jika ditembus dapat meningkatkan pergerakan pemulihan ke garis resistensi lain, dari 1 Juli, saat ini di sekitar 106,60, diikuti oleh tingkat SMA 200-bar di 106,67.

Jika berhasil naik di atas 106,70, puncak akhir Juli di dekat 107,55 akan terlihat pada radar mereka.

Selain itu, support horizontal dua pekan di dekat 105,30 dapat menghibur penjual jangka pendek sebelum mendorong mereka menuju terendah bulan Juli di dekat 104,20.

Namun, 104,80 dan 105,00 adalah beberapa buffer tambahan yang bisa dimanfaatkan oleh pasangan ini selama penurunan lebih lanjut.

Grafik empat jam USD/JPY

Grafik USD/JPY

Tren: Bearish


Penilaian Pasar Saham Global Terlihat Berlebihan, Menurut Indikator Buffett

Pasar saham global sekarang bernilai lebih dari 100% dari Produk Domestik Bruto (PDB) dunia untuk pertama kalinya sejak 2018, sebuah tanda penilaian y
Read more Previous

Analisa Harga EUR/CHF: Golden Cross Pada Grafik Harian

EUR/CHF diperdagangkan hijau pada hari ini dengan grafik harian menunjukkan golden cross, indikator pasar bull jangka panjang.  Golden cross adalah p
Read more Next