Confirming you are not from the U.S. or the Philippines

By giving this statement, I explicitly declare and confirm that:
  • I am not a U.S. citizen or resident
  • I am not a resident of the Philippines
  • I do not directly or indirectly own more than 10% of shares/voting rights/interest of the U.S. residents and/or do not control U.S. citizens or residents by other means
  • I am not under the direct or indirect ownership of more than 10% of shares/voting rights/interest and/or under the control of U.S. citizen or resident exercised by other means
  • I am not affiliated with U.S. citizens or residents in terms of Section 1504(a) of FATCA
  • I am aware of my liability for making a false declaration.
For the purposes of this statement, all U.S. dependent countries and territories are equalled to the main territory of the USA. I accept full responsibility for the accuracy of this declaration and commit to personally address and resolve any claims or issues that may arise from a breach of this statement.
We are dedicated to your privacy and the security of your personal information. We only collect emails to provide special offers and important information about our products and services. By submitting your email address, you agree to receive such letters from us. If you want to unsubscribe or have any questions or concerns, write to our Customer Support.
Octa trading broker
Open trading account
Back

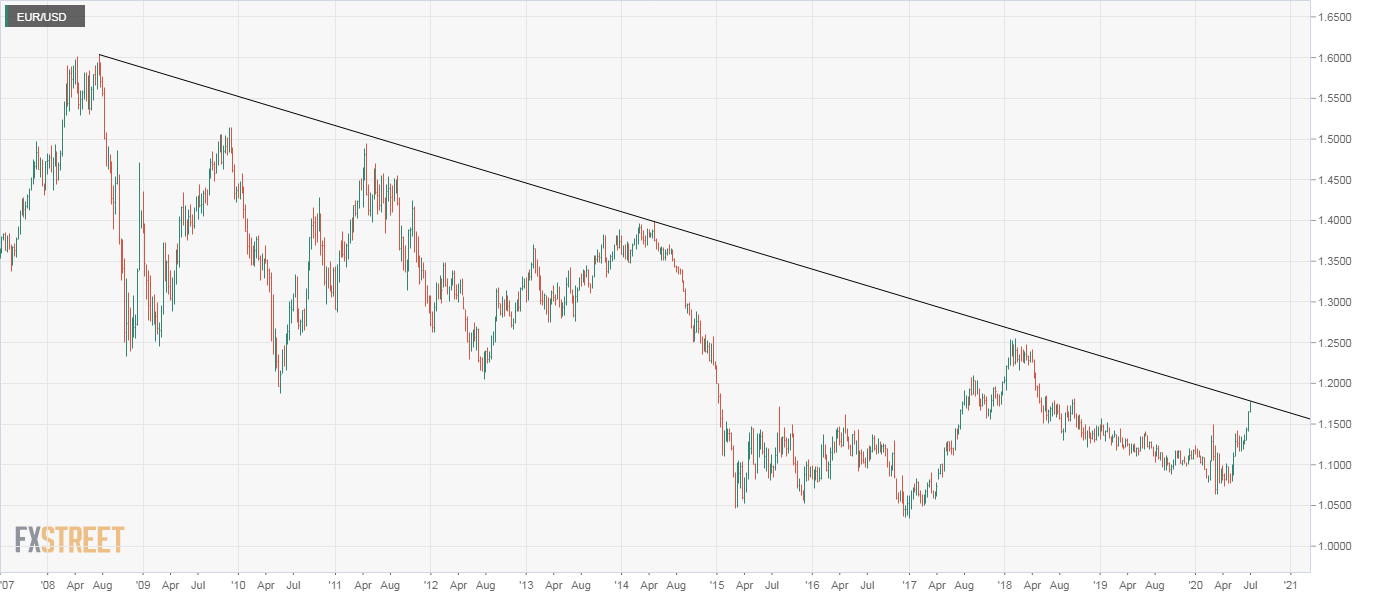
EUR/USD Price Analysis: Nears 12-year-long falling trendline

  • EUR/USD probes a 12-year-long macro bearish trendline. 
  • A break higher may remain elusive for some time due to overbought conditions. 

The American dollar's relentless sell-off has pushed the EUR/USD close to the resistance of the trendline falling from July 2008 and May 2014 highs. 

At press time, the trendline resistance is located at 1.1788. The pair clocked a high fo 1.1781 during the overnight trade and is now trading at 1.1764, representing a 0.9% gain on a week-to-date basis. 

A strong move above 1.1788 would imply an end of the decade long macro bearish trend. That said, the 61.8% Fibonacci retracement of the sell-off from the February 2018 high of 1.2556 to the 2020 low of 1.0636 is located at 1.1822. A violation there would be stronger evidence of the bullish breakout. 

However, with the 14-day relative strength index reporting extreme overbought conditions, the bulls may have a tough time forcing a convincing break above 1.1822 in the short-run. 

The pair looks vulnerable to a sudden pullback to the ascending 5-day simple moving average (SMA), currently at 1.1667. 

Weekly chart
Trend: Bullish but overbought

Technical levels


White House chief of staff Meadows: Had very productive meeting' with Pelosi on the aid bill

White House chief of staff Meadows has crossed the wires and has said it was a `very productive meeting' with Pelosi on the aid bill. Will return for
Read more Previous

USD/JPY stays heavy near 4-½ month low on Tokyo open

USD/JPY drops to 105.22, down 0.15% on a day, as traders in kick-start Tuesday with the same bearish mood. While US dollar weakness underpins the yen
Read more Next