Confirming you are not from the U.S. or the Philippines

By giving this statement, I explicitly declare and confirm that:
  • I am not a U.S. citizen or resident
  • I am not a resident of the Philippines
  • I do not directly or indirectly own more than 10% of shares/voting rights/interest of the U.S. residents and/or do not control U.S. citizens or residents by other means
  • I am not under the direct or indirect ownership of more than 10% of shares/voting rights/interest and/or under the control of U.S. citizen or resident exercised by other means
  • I am not affiliated with U.S. citizens or residents in terms of Section 1504(a) of FATCA
  • I am aware of my liability for making a false declaration.
For the purposes of this statement, all U.S. dependent countries and territories are equalled to the main territory of the USA. I accept full responsibility for the accuracy of this declaration and commit to personally address and resolve any claims or issues that may arise from a breach of this statement.
We are dedicated to your privacy and the security of your personal information. We only collect emails to provide special offers and important information about our products and services. By submitting your email address, you agree to receive such letters from us. If you want to unsubscribe or have any questions or concerns, write to our Customer Support.
Octa trading broker
Open trading account
Back

AUD/JPY Price Analysis: Depressed below 73.50 inside symmetrical triangle

  • AUD/JPY rolls on the late-Friday weakness from 73.64 amid broad risk-off mood.
  • A two-week-old triangle restricts the pair’s immediate moves.
  • An ascending trend line from May 06, 200-bar EMA act as additional downside filters.

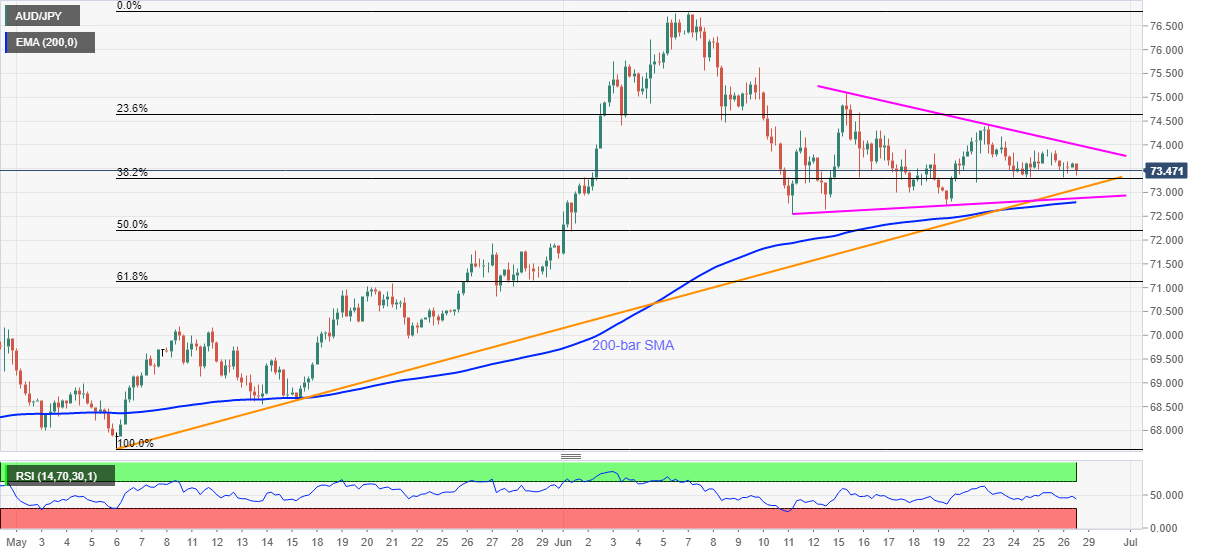
AUD/JPY bounces off intraday low of 73.36 to 73.47 during the early Asian session on Monday. Though, the pair keeps the short-term symmetrical triangle formation intact despite the last week’s downbeat performance.

Even so, an upward sloping trend line from early-May, at 73.07 now, seems to lure the bears ahead of highlighting the triangle’s support line near 72.85. Also acting as the near-term key support is the 200-bar SMA near 72.80.

Hence, the sellers may await a clear break below 72.80 to aim for late-May top surrounding 71.90 whereas any more downside could push them towards 61.8% Fibonacci retracement of May-June upside, near 71.10.

Alternatively, the resistance line of the said triangle formation, currently near 74.00, becomes an immediate upside barrier to watch, a break of which could aim for 74.40 and the mid-month high 75.10.

In a case where the bulls remain dominant past-75.10, 75.70 and 76.25/30 might offer intermediate halts before challenging the monthly high around 76.80.

AUD/JPY four-hour chart
Trend: SIdeways


Gold Price Analysis: XAU/USD refreshes multi-year high above $1,775 as virus woes deepen

Gold prices trade near $1,775, intraday high of $1,775.94, during the early Monday morning in Asia. The bullion recently surged to the fresh high over
Read more Previous

New Zealand Total Filled Jobs declined to 0.8M in May from previous 2.16M

New Zealand Total Filled Jobs declined to 0.8M in May from previous 2.16M
Read more Next