Confirming you are not from the U.S. or the Philippines

By giving this statement, I explicitly declare and confirm that:
  • I am not a U.S. citizen or resident
  • I am not a resident of the Philippines
  • I do not directly or indirectly own more than 10% of shares/voting rights/interest of the U.S. residents and/or do not control U.S. citizens or residents by other means
  • I am not under the direct or indirect ownership of more than 10% of shares/voting rights/interest and/or under the control of U.S. citizen or resident exercised by other means
  • I am not affiliated with U.S. citizens or residents in terms of Section 1504(a) of FATCA
  • I am aware of my liability for making a false declaration.
For the purposes of this statement, all U.S. dependent countries and territories are equalled to the main territory of the USA. I accept full responsibility for the accuracy of this declaration and commit to personally address and resolve any claims or issues that may arise from a breach of this statement.
We are dedicated to your privacy and the security of your personal information. We only collect emails to provide special offers and important information about our products and services. By submitting your email address, you agree to receive such letters from us. If you want to unsubscribe or have any questions or concerns, write to our Customer Support.
Octa trading broker
Open trading account
Back

Gold Price Analysis: Bears attack $1,700 inside short-term triangle

  • Gold prices snap three-day winning streak.
  • 200-bar SMA, 61.8% Fibonacci retracement will restrict downside below the triangle.
  • A three-week-old falling trend line adds to the resistance.

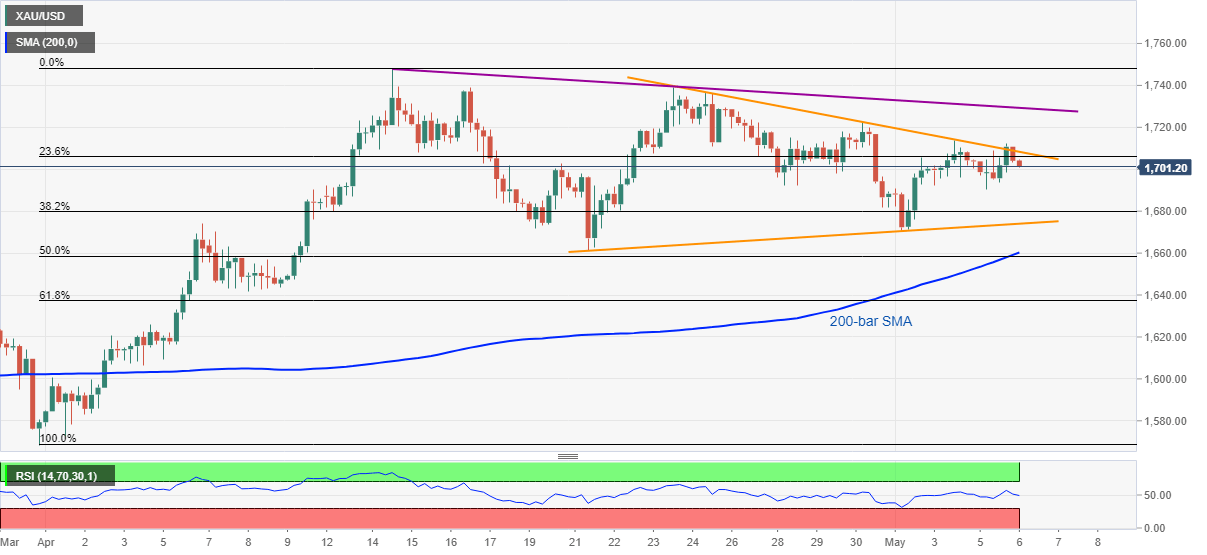
Gold drops to $1,702, down 0.18% on a day, during the Asian session’s trading on Wednesday. That said, the yellow metal keeps trading between the two-week-old symmetrical triangle.

As a result, sellers can aim for the weekly low surrounding $1,690 once the Gold prices drop below $1,700 round-figure. However, the pattern’s support around $1,674 could limit the bullion’s further downside.

If at all bears dominate past-$1,674, 200-bar SMA and 61.8% Fibonacci retracement of March 31 to April 14 upside, respectively, near $1,660 and $1,637, will be on their radars.

Alternatively, a sustained upside break of the said triangle’s resistance, at $1,709 now, can trigger the precious metal’s recovery towards a falling trend line from April 14 that stays around $1,730 at present.

It’s worth mentioning that the bullion’s rise past-$1,730 enables it to challenge the previous month top around $1,748 and aim for the year 2012 high close to $1,496.

Gold four-hour chart
Trend: Further declines expected


USD/JPY drops to fres daily lows to test 106.20

USD/JPY is moving lower and testing 106.20 lows and the lowest levels since March of earlier this year. The move started overnight in the European ses
Read more Previous

AUD/JPY: Yen demand weighs, eyes Aussie retail sales data

The anti-risk Yen is drawing bids at press time and pushing the AUD/JPY lower ahead of the Australian retail sales data. Rejected at 20-day MA The pai
Read more Next