Confirming you are not from the U.S. or the Philippines

By giving this statement, I explicitly declare and confirm that:
  • I am not a U.S. citizen or resident
  • I am not a resident of the Philippines
  • I do not directly or indirectly own more than 10% of shares/voting rights/interest of the U.S. residents and/or do not control U.S. citizens or residents by other means
  • I am not under the direct or indirect ownership of more than 10% of shares/voting rights/interest and/or under the control of U.S. citizen or resident exercised by other means
  • I am not affiliated with U.S. citizens or residents in terms of Section 1504(a) of FATCA
  • I am aware of my liability for making a false declaration.
For the purposes of this statement, all U.S. dependent countries and territories are equalled to the main territory of the USA. I accept full responsibility for the accuracy of this declaration and commit to personally address and resolve any claims or issues that may arise from a breach of this statement.
We are dedicated to your privacy and the security of your personal information. We only collect emails to provide special offers and important information about our products and services. By submitting your email address, you agree to receive such letters from us. If you want to unsubscribe or have any questions or concerns, write to our Customer Support.
Octa trading broker
Open trading account
Back

WTI Price Analysis: Bears keep the helm below 61.8% Fibonacci

  • WTI remains on the back foot while following the immediate descending trend line since Friday.
  • The monthly low, $20.00 are on the bears’ radars.
  • 200-HMA, an eight-day-old falling resistance line add to the upside barriers.

Despite bouncing off $21.20 to $23.30, down 2.35%, WTI remains under pressure amid Monday’s Asian session. The oil benchmark currently probes short-term falling trend line while 50% Fibonacci retracement of its March 11-18 declines and 200-HMA, adjacent to a bit broader resistance, limit the near-term upside.

Should the buyers manage to cross the immediate resistance line, currently at $23.70, the black gold can accelerate the recovery moves to 50% Fibonacci retracement level near $28.60.

However, 200-HMA and the aforementioned falling trend line could challenge the buyers around $29.20 and $29.65 respectively.

It should also be noted that the oil price run-up beyond $29.65 needs to overcome a 61.8% Fibonacci retracement level of $30.50 to convince buyers.

Meanwhile, the quote’s downside below $21.20 can aim the monthly low near $20.50 and $20.00 round-figures.

WTI hourly chart
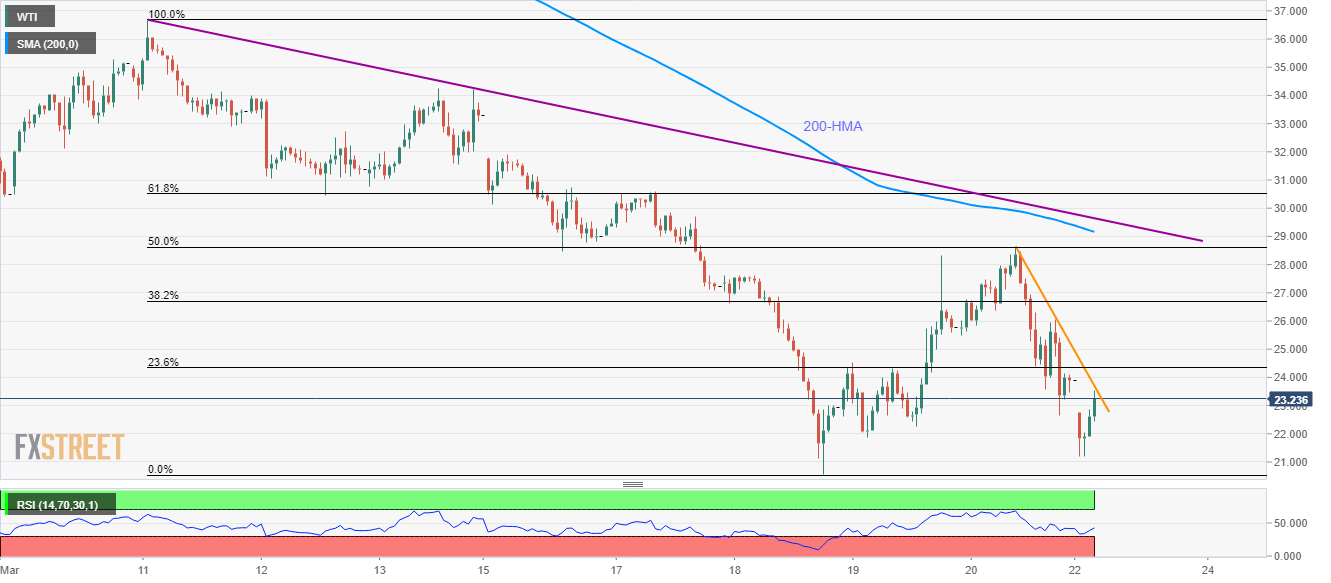
Trend: Bearish


US initial jobless claims to rise to 3 million this week - Bank of America Merrill Lynch

Bank of America Merrill Lynch expects the US initial jobless claims or the number of new jobless claims for unemployment benefits filed by unemployed
Read more Previous

EUR/USD Price Analysis: Bounces off multi-month low to regain 1.0720

Following its initial drop to a 35-month low, EUR/USD marks 0.13% gains to 1.0711, with an intraday high of 1.0720, amid the early Monday. While takin
Read more Next