Confirming you are not from the U.S. or the Philippines

By giving this statement, I explicitly declare and confirm that:
  • I am not a U.S. citizen or resident
  • I am not a resident of the Philippines
  • I do not directly or indirectly own more than 10% of shares/voting rights/interest of the U.S. residents and/or do not control U.S. citizens or residents by other means
  • I am not under the direct or indirect ownership of more than 10% of shares/voting rights/interest and/or under the control of U.S. citizen or resident exercised by other means
  • I am not affiliated with U.S. citizens or residents in terms of Section 1504(a) of FATCA
  • I am aware of my liability for making a false declaration.
For the purposes of this statement, all U.S. dependent countries and territories are equalled to the main territory of the USA. I accept full responsibility for the accuracy of this declaration and commit to personally address and resolve any claims or issues that may arise from a breach of this statement.
We are dedicated to your privacy and the security of your personal information. We only collect emails to provide special offers and important information about our products and services. By submitting your email address, you agree to receive such letters from us. If you want to unsubscribe or have any questions or concerns, write to our Customer Support.
Octa trading broker
Open trading account
Test
Back

AUD/JPY Price Analysis: Bearish spinning top portrays sellers’ exhaustion

  • AUD/JPY remains under pressure for the first consecutive day.
  • The candlestick on the daily chart suggests sellers’ exhaustion, a pullback move.
  • 5-day SMA, monthly resistance line restrict immediate recovery.

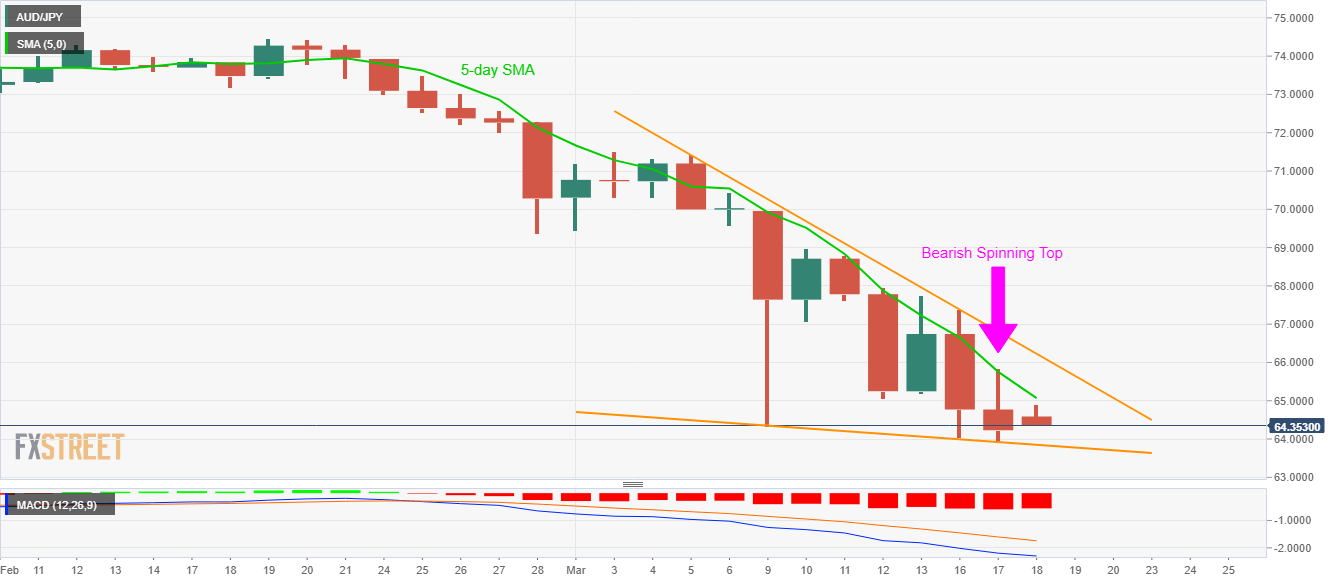
While extending its declines for the third day in a row, AUD/JPY drops to 64.35 amid the early Asian session on Wednesday. Even so, the pair portrays sellers’ exhaustion on the daily chart suggesting bounces off the short-term support line.

In a case where the bearish MACD drags the quote below the seven-day-old falling trend line, at 63.85, the sellers could take further steps to inch closer towards 63.00 whereas early- February 2009 tops near 62.60 might entertain the sellers afterward.

On the upside, 5-day SMA offers the immediate resistance around 65.10 while the monthly falling trend line, currently near 66.25, can question the bulls then after.

In a case where the buyers manage to cross 66.25 on a daily closing basis, they confirm the short-term bullish technical formation, namely falling wedge, which in turn could trigger the fresh run-up towards the monthly top near 71.40/45.

AUD/JPY daily chart
Trend: Pullback expected


US Treasury Secretary Mnuchin: Coronavirus outbreak could push unemployment up to 20% without action

US Treasury Secretary Mnuchin stated that the Coronavirus outbreak could push unemployment up to 20% without action. Mnuchin also said the Trump admin
Read more Previous

WTI stabilizing just ahead of the 2016 lows

West Texas Intermediate crude came in a stone throw of the 2016 lows on Tuesday in the US session but bounced late in the day and is currently trading
Read more Next