Confirming you are not from the U.S. or the Philippines

By giving this statement, I explicitly declare and confirm that:
  • I am not a U.S. citizen or resident
  • I am not a resident of the Philippines
  • I do not directly or indirectly own more than 10% of shares/voting rights/interest of the U.S. residents and/or do not control U.S. citizens or residents by other means
  • I am not under the direct or indirect ownership of more than 10% of shares/voting rights/interest and/or under the control of U.S. citizen or resident exercised by other means
  • I am not affiliated with U.S. citizens or residents in terms of Section 1504(a) of FATCA
  • I am aware of my liability for making a false declaration.
For the purposes of this statement, all U.S. dependent countries and territories are equalled to the main territory of the USA. I accept full responsibility for the accuracy of this declaration and commit to personally address and resolve any claims or issues that may arise from a breach of this statement.
We are dedicated to your privacy and the security of your personal information. We only collect emails to provide special offers and important information about our products and services. By submitting your email address, you agree to receive such letters from us. If you want to unsubscribe or have any questions or concerns, write to our Customer Support.
Octa trading broker
Open trading account
Back

GBP/USD Price Analysis: 1.2855/60 guards immediate upside

  • GBP/USD struggles to extend the south-run below multi-week bottom, 61.8% Fibonacci retracement.
  • A confluence of 200-day EMA and 50% Fibonacci retracement limits the pair’s pullback moves.
  • A downside break will highlight September 2019 top for the bears.

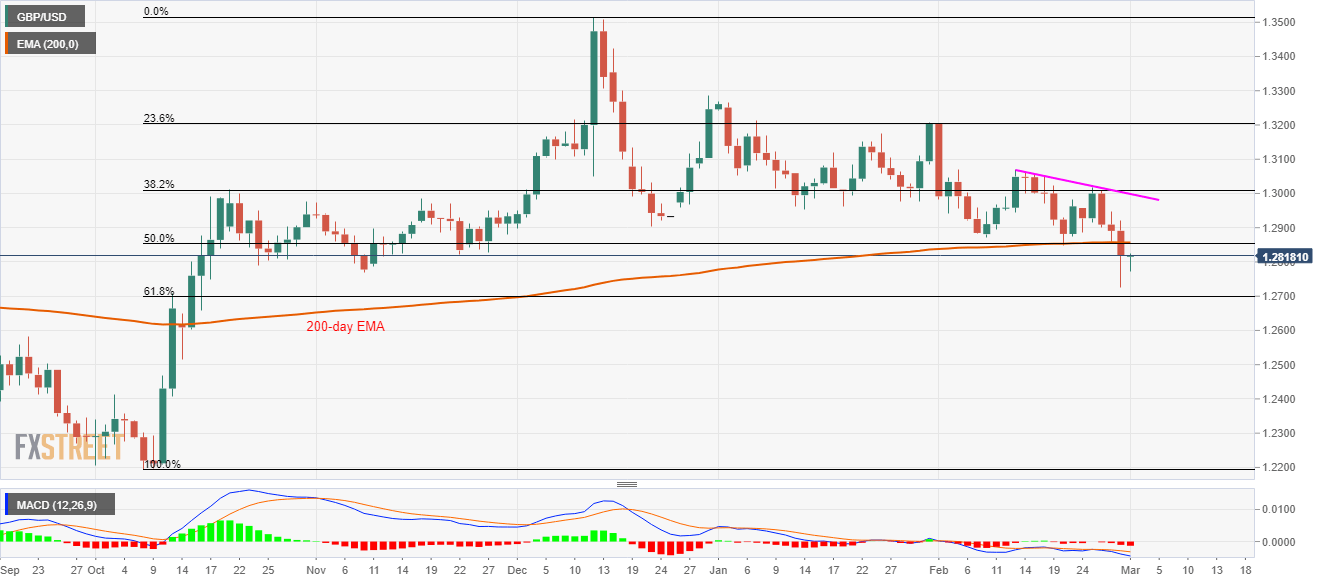
GBP/USD remains mostly stable around 1.2818, after declining to the lowest since October 16, 2019, on Friday, during the Asian session on Monday.

Even so, the pair remains below the key short-term resistance comprising 200-day EMA and 50% Fibonacci retracement of October-December 2019 upside, around 1.2855/60.

If at all prices manage to cross 1.2860 on a daily closing basis, a descending trend line from February 13 near 1.3000 will be on the bulls’ radars.

Meanwhile, 61.8% Fibonacci retracement level of 1.2700 acts as the immediate support ahead of September 2019 high close to 1.2580.

Should there be a further decline past-1.2580, 1.2415 and October 2019 low near 1.2200 will lure the bears.

GBP/USD daily chart
Trend: Bearish


EUR/USD Price Analysis: Pressing into 61.8% Fib resistance

EUR/USD continues to gain ground amid sustained coronavirus-led risk aversion in the equity markets and could end up scaling the all-important 61.8% F
Read more Previous

Stats NZ: Exports to China fell 8% y/y in the 4 weeks to Feb 23

Officials at Statistics New Zealand (Stats NZ) said in a statement on Monday, the country’s provisional exports data to China dropped sharply due to t
Read more Next