Confirming you are not from the U.S. or the Philippines

By giving this statement, I explicitly declare and confirm that:
  • I am not a U.S. citizen or resident
  • I am not a resident of the Philippines
  • I do not directly or indirectly own more than 10% of shares/voting rights/interest of the U.S. residents and/or do not control U.S. citizens or residents by other means
  • I am not under the direct or indirect ownership of more than 10% of shares/voting rights/interest and/or under the control of U.S. citizen or resident exercised by other means
  • I am not affiliated with U.S. citizens or residents in terms of Section 1504(a) of FATCA
  • I am aware of my liability for making a false declaration.
For the purposes of this statement, all U.S. dependent countries and territories are equalled to the main territory of the USA. I accept full responsibility for the accuracy of this declaration and commit to personally address and resolve any claims or issues that may arise from a breach of this statement.
We are dedicated to your privacy and the security of your personal information. We only collect emails to provide special offers and important information about our products and services. By submitting your email address, you agree to receive such letters from us. If you want to unsubscribe or have any questions or concerns, write to our Customer Support.
Octa trading broker
Open trading account
Back

USD/JPY Price Analysis: Eyes on long-term resistance-turned-support trendline

  • USD/JPY struggles to rise beyond a 10-month high.
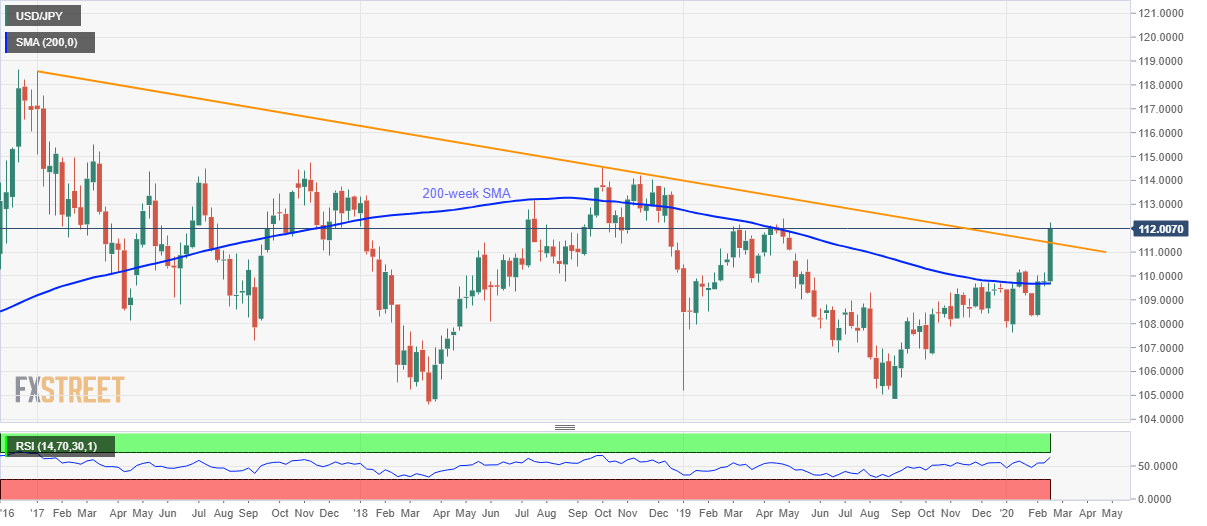
  • The quote pierces a downward sloping trend line from January 2017, sustained break on a weekly basis can confirm further upside.
  • 200-week SMA acts as key support.

USD/JPY steps back to 112.00, down 0.07%, during the pre-European session on Friday. Even so, the pair stays above the multi-month-old falling trend line on a weekly basis.

Should the pair closes the week beyond 111.40 resistance-turned-support, its run-up to 112.40 and November 2018 high near 114.20 can be expected.

During the pair’s extended rise past-114.20, October 2018 top surrounding 114.55 will be on the bulls’ radar.

Meanwhile, a downside break of 111.40 on the weekly closing basis can recall a 200-week SMA level of 109.70.

However, 111.00 and January 2020 peak close to 110.30 may offer intermediate halts to the declines.

USD/JPY weekly chart
Trend: Bullish


Gold hits fresh seven-year high

Gold is flashing green for the fourth straight day and is currently trading at $1,624, the highest level February 2013. The anti-risk yellow metal con
Read more Previous

Dollar Index Price Analysis: Golden cross suggests greenback is closing on interim top

The dollar index, which tracks the value of the greenback against majors, could be nearing an interim top, as a big-time lagging indicator has turned
Read more Next