
Our best spreads and conditions
 About platform

USD/JPY rises to 109.86, following the uptick to an intra-day high of 109.91, during the early Friday. In doing so, the quote recovers the previous day’s losses while taking a U-turn from 50-bar SMA.
While the current upside rush highlights a monthly falling trend line resistance, at 110.12, the quote’s further advances are likely to be tamed considering bearish MACD and normal RSI.
In a case buyers manage to cross 110.12, January month high near 110.30 holds the key to pair’s run-up towards May 2019 top surrounding 110.70.
On the downside, 50-bar SMA of 109.73 and a horizontal area comprising 38.2% Fibonacci retracement of January month upside near 109.30 can restrict the quote’s short-term declines.
During the pair’s declines below 109.30, 108.70/65 becomes important as it includes an ascending trend line from January month low and 61.8% Fibonacci retracement level.
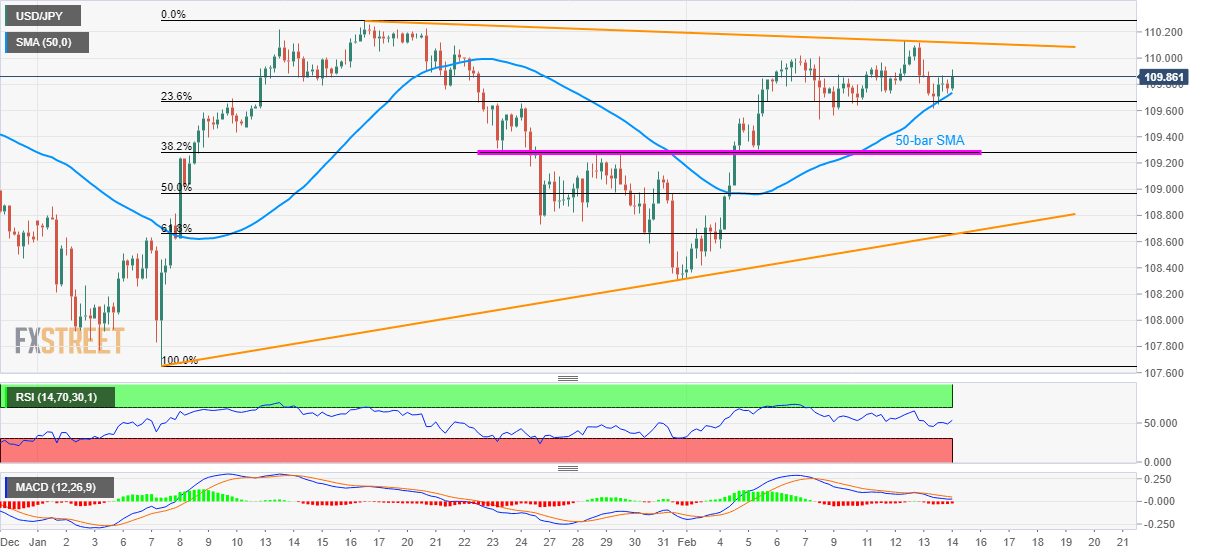
Trend: Pullback expected


