Confirming you are not from the U.S. or the Philippines

By giving this statement, I explicitly declare and confirm that:
  • I am not a U.S. citizen or resident
  • I am not a resident of the Philippines
  • I do not directly or indirectly own more than 10% of shares/voting rights/interest of the U.S. residents and/or do not control U.S. citizens or residents by other means
  • I am not under the direct or indirect ownership of more than 10% of shares/voting rights/interest and/or under the control of U.S. citizen or resident exercised by other means
  • I am not affiliated with U.S. citizens or residents in terms of Section 1504(a) of FATCA
  • I am aware of my liability for making a false declaration.
For the purposes of this statement, all U.S. dependent countries and territories are equalled to the main territory of the USA. I accept full responsibility for the accuracy of this declaration and commit to personally address and resolve any claims or issues that may arise from a breach of this statement.
We are dedicated to your privacy and the security of your personal information. We only collect emails to provide special offers and important information about our products and services. By submitting your email address, you agree to receive such letters from us. If you want to unsubscribe or have any questions or concerns, write to our Customer Support.
Octa trading broker
Open trading account
Back

EUR/USD Price Analysis: Euro hits lowest level since April 2017

  • EUR/USD has dropped to the levels last seen in April 2017. 
  • The weekly candle indicate the path of least resistance is to the downside. 
  • Short-term oversold conditions suggest scope for a corrective bounce. 

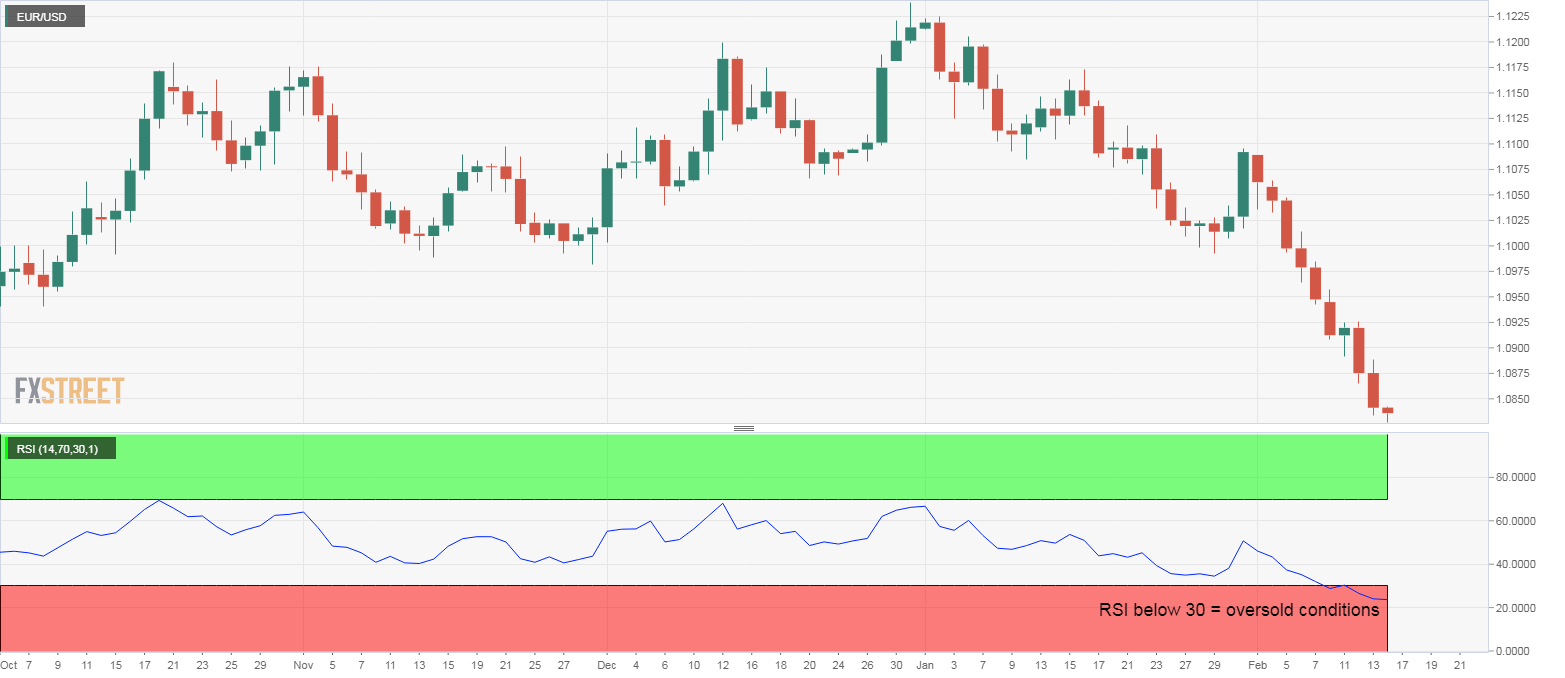
EUR/USD breached support at 1.0839 a few minutes before press time and fell to 1.0827, the lowest levels since April 2017. 

The bearish trend looks quite strong with the weekly candle carrying little or no wicks, similar to last week's big bearish "marubozu" candle. 

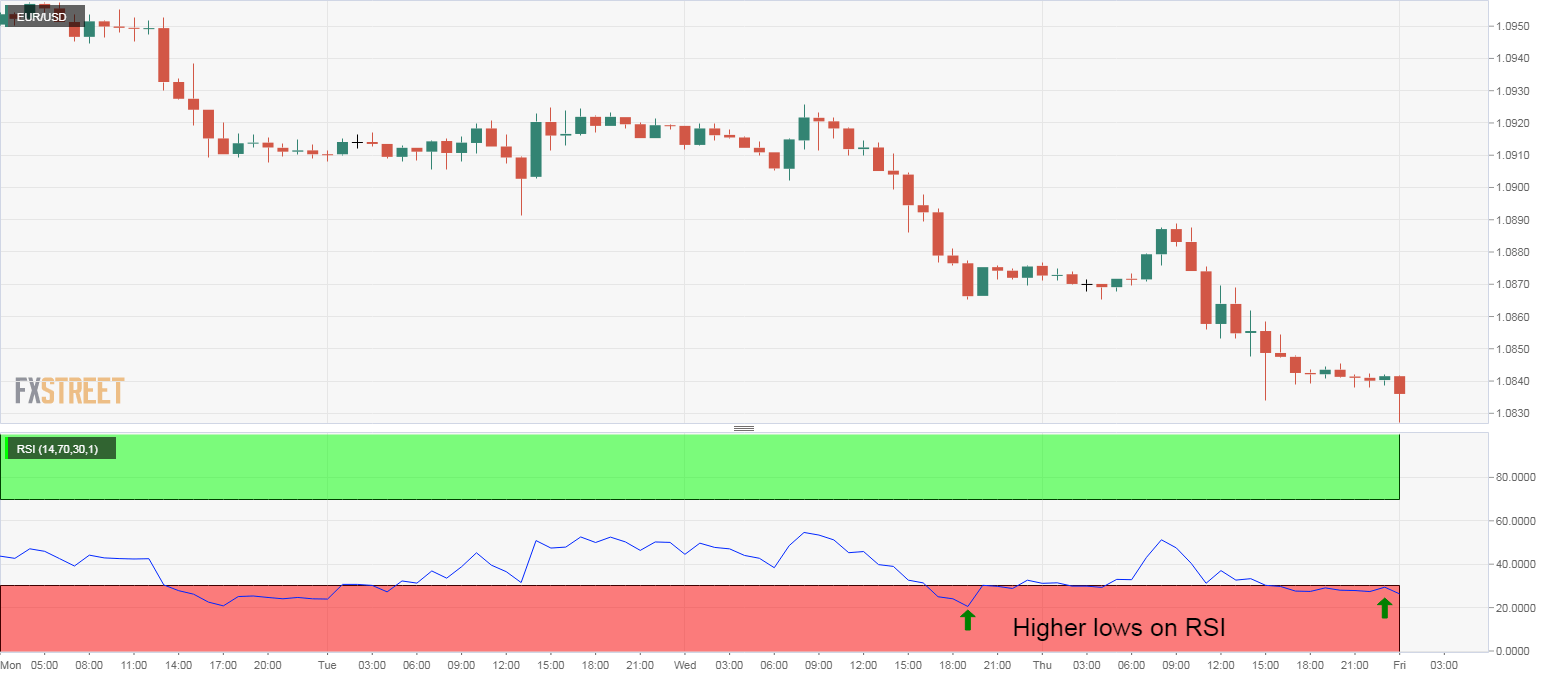
That said, the 14-day relative strength index (RSI) is now reporting oversold conditions and the hourly chart RSI is printing higher lows, contradicting lower lows on price (bullish divergence).

As a result, a corrective bounce may be seen before further declines toward levels below 1.08. 

An oversold bounce, if any, could challenge the former hourly chart support-turned-resistance of 1.0865, above which the focus would shift to the descending or bearish 50-hour average at 1.0880.

Daily chart

Hourly chart

Trend: Bearish

Technical levels


Gold: Mildly positive below $1580 as risk aversion continues

Gold remains firm around $1,578 during Friday’s Asian session. The extension of an increase in coronavirus cases seems to have favored the bullion’s l
Read more Previous

NZD/USD Price Analysis: Buyers will look for entry beyond 0.6485/90

NZD/USD declines to 0.6440 during the early Asian session on Friday. The pair recently slipped below 23.6% Fibonacci retracement of January 16 to Febr
Read more Next