Confirming you are not from the U.S. or the Philippines

By giving this statement, I explicitly declare and confirm that:
  • I am not a U.S. citizen or resident
  • I am not a resident of the Philippines
  • I do not directly or indirectly own more than 10% of shares/voting rights/interest of the U.S. residents and/or do not control U.S. citizens or residents by other means
  • I am not under the direct or indirect ownership of more than 10% of shares/voting rights/interest and/or under the control of U.S. citizen or resident exercised by other means
  • I am not affiliated with U.S. citizens or residents in terms of Section 1504(a) of FATCA
  • I am aware of my liability for making a false declaration.
For the purposes of this statement, all U.S. dependent countries and territories are equalled to the main territory of the USA. I accept full responsibility for the accuracy of this declaration and commit to personally address and resolve any claims or issues that may arise from a breach of this statement.
We are dedicated to your privacy and the security of your personal information. We only collect emails to provide special offers and important information about our products and services. By submitting your email address, you agree to receive such letters from us. If you want to unsubscribe or have any questions or concerns, write to our Customer Support.
Octa trading broker
Open trading account
Back

USD/INR Price Analysis: Steps back from five-day top to key SMAs

  • USD/INR stays in a short-term symmetrical triangle.
  • A confluence of 50 and 100-day SMA offer intermediate direction.

USD/INR declines to 71.34 amid the initial Indian session on Monday. In doing so, the pair snaps the three-day winning streak while also takes a U-turn from the monthly falling resistance line, forming part of the multi-day-old symmetrical triangle.

With this, the pair is likely to revisit a confluence of 50 and 100-day SMA confluence around 71.24/28 whereas the month’s bottom near 71.07 could question its further downside.

Should USD/INR prices remain soft below 71.07, the aforementioned triangle’s support line and 23.6% Fibonacci retracement of the pair’s September-December 2019 fall, around 70.80, will be the key level to watch.

On the contrary, the quote’s run-up beyond 71.60 resistance line can take aim at a 61.8% Fibonacci retracement level of 71.73.

However, 71.85, 72.00 and 72.20/22 will challenge the bulls during the post-71.73 run-up.
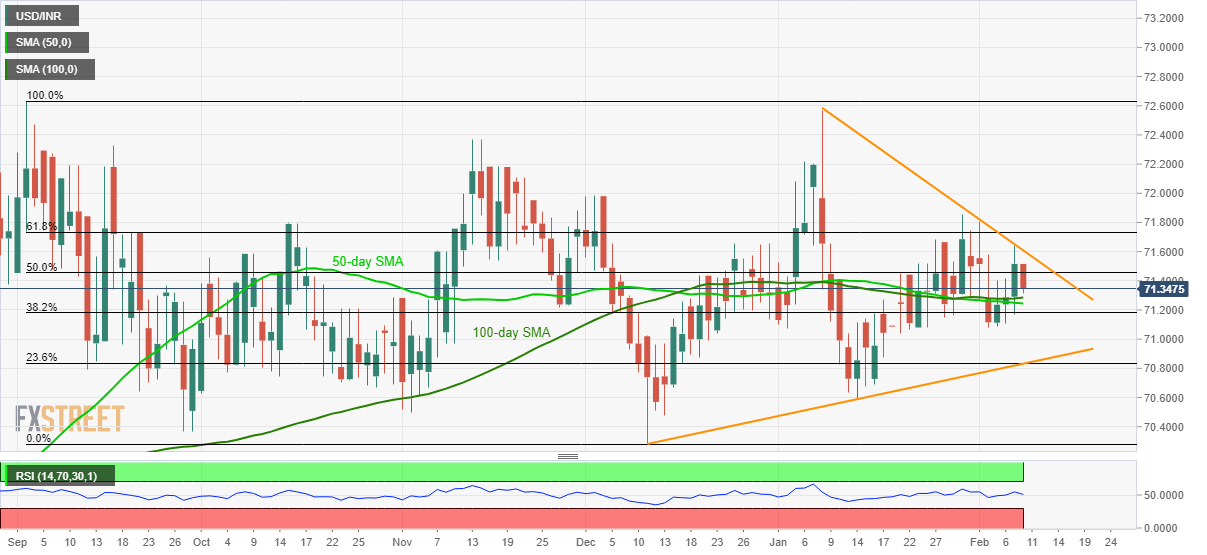
USD/INR daily chart

Trend: Sideways

FXStreet Indonesian Site - new domain!

Access it at www.fxstreet-id.com


EUR/USD prints longest daily losing run since November

EUR/USD fell for the fifth straight day on Friday, confirming its longest daily losing trend since the first half of November. The currency pair close
Read more Previous

UK’s Raab: Confident of trade deal with the US in wave one

During a visit to Singapore, the UK Foreign Secretary Dominic Raab said on Monday, he is confident of trade deal with the US in wave one. Key Quotes:
Read more Next