Confirming you are not from the U.S. or the Philippines

By giving this statement, I explicitly declare and confirm that:
  • I am not a U.S. citizen or resident
  • I am not a resident of the Philippines
  • I do not directly or indirectly own more than 10% of shares/voting rights/interest of the U.S. residents and/or do not control U.S. citizens or residents by other means
  • I am not under the direct or indirect ownership of more than 10% of shares/voting rights/interest and/or under the control of U.S. citizen or resident exercised by other means
  • I am not affiliated with U.S. citizens or residents in terms of Section 1504(a) of FATCA
  • I am aware of my liability for making a false declaration.
For the purposes of this statement, all U.S. dependent countries and territories are equalled to the main territory of the USA. I accept full responsibility for the accuracy of this declaration and commit to personally address and resolve any claims or issues that may arise from a breach of this statement.
We are dedicated to your privacy and the security of your personal information. We only collect emails to provide special offers and important information about our products and services. By submitting your email address, you agree to receive such letters from us. If you want to unsubscribe or have any questions or concerns, write to our Customer Support.
Octa trading broker
Open trading account
Back

USD/CHF Price Analysis: Heavy inside two-week-old ascending channel

  • USD/CHF snaps two-day winning streak, reversed from monthly resistance line.
  • Buyers will remain hopeful unless the channel’s support breaks.
  • 50% and 38.2% of Fibonacci retracements could offer intermediate halts during the declines.

USD/CHF declines to 0.9728, -0.11%, by the press time of early Thursday. The pair recently reversed from an ascending trend line since December 29, 2019. Even so, it stays inside the short-term bullish technical formation.

Considering the pair’s latest pullback form the key resistance, sellers can target 50% and 38.2% of Fibonacci retracements of the pair’s declines between December 24, 2019, and January 16, 2020, around 0.9720 and 0.9700 respectively.

However, the channel’s support line, at 0.9690, could restrict further declines, if not then 0.9660 and 0.9613 can offer intermediate halts during the fall to 0.9600.

On the flip side, the aforementioned resistance line and the said channel’s upper line could restrict the pair’s short-term recovery near 0.9770/75.

In a case where the bulls dominate beyond 0.9775, 0.9800 and 0.9825 will flash on their radars.

USD/CHF four-hour chart
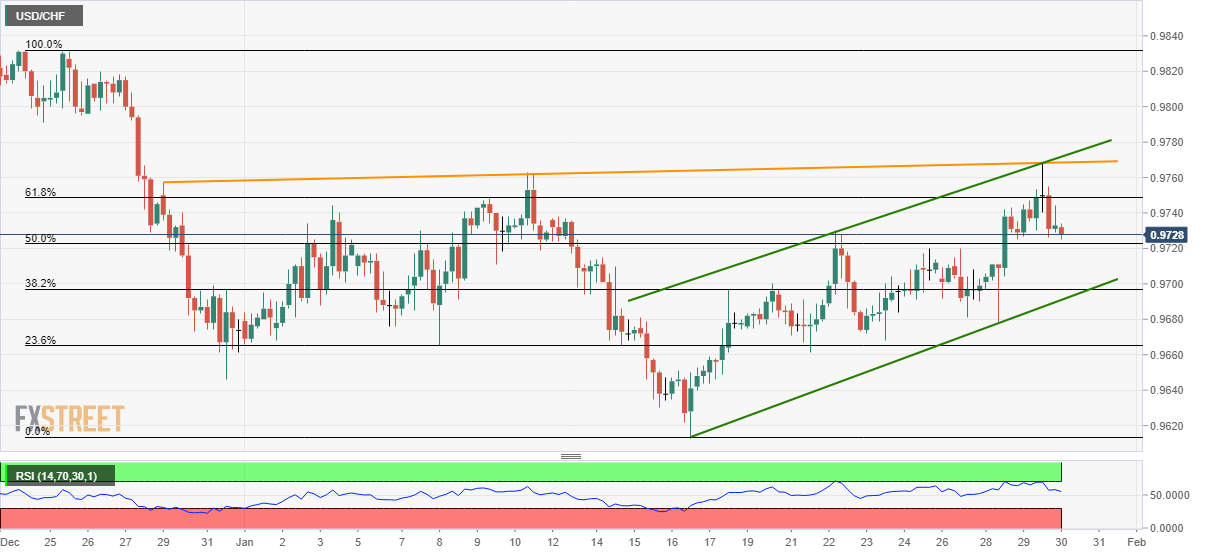
Trend: Bullish


WTI eyes biggest monthly price loss since May 2019

West Texas Intermediate oil is on track to post its biggest and the first double-digit monthly loss since May 2019. The black gold is currently tradin
Read more Previous

AUD/NZD Price Analysis: Critical divergence supporting bullish bias towards Fibo targets

AUD/NZD has been recovering from a major support structure and targets a run towards a 23.6% Fibonacci retracement of the daily highs (buy stop liquid
Read more Next