Confirming you are not from the U.S. or the Philippines

By giving this statement, I explicitly declare and confirm that:
  • I am not a U.S. citizen or resident
  • I am not a resident of the Philippines
  • I do not directly or indirectly own more than 10% of shares/voting rights/interest of the U.S. residents and/or do not control U.S. citizens or residents by other means
  • I am not under the direct or indirect ownership of more than 10% of shares/voting rights/interest and/or under the control of U.S. citizen or resident exercised by other means
  • I am not affiliated with U.S. citizens or residents in terms of Section 1504(a) of FATCA
  • I am aware of my liability for making a false declaration.
For the purposes of this statement, all U.S. dependent countries and territories are equalled to the main territory of the USA. I accept full responsibility for the accuracy of this declaration and commit to personally address and resolve any claims or issues that may arise from a breach of this statement.
We are dedicated to your privacy and the security of your personal information. We only collect emails to provide special offers and important information about our products and services. By submitting your email address, you agree to receive such letters from us. If you want to unsubscribe or have any questions or concerns, write to our Customer Support.
Octa trading broker
Open trading account
Back

WTI Price Analysis: Under pressure inside three-week-old falling channel

  • WTI fails to extend recovery from the bearish formation’s support, ignores bullish MACD.
  • 200-bar SMA acts as the key upside resistance.
  • Multiple lows from early-2019 lure sellers during further declines.

WTI stays on the back foot while flashing $53.15 as a quote during Thursday’s Asian session. The energy benchmark fails to cross late-Friday tops during its latest bounce. In doing so, it justifies the near-term bearish formation.

That said, oil prices are now declining towards the weekly low of $52.17 while the channel’s support line near $50.70 can lure the bears afterward.

Though, multiple lows marked since late-January 2019 around $50.60 and $50.00 round-figure could keep the sellers checked below $50.70.

Meanwhile, an immediate horizontal resistance line near $54.40 and the bearish pattern’s upper line, at $54.65, could keep the energy benchmark’s near-term recovery capped.

If at all buyers manage to conquer $54.65, 200-bar SMA level near $59.30 will keep them away from $60.00 resistance.
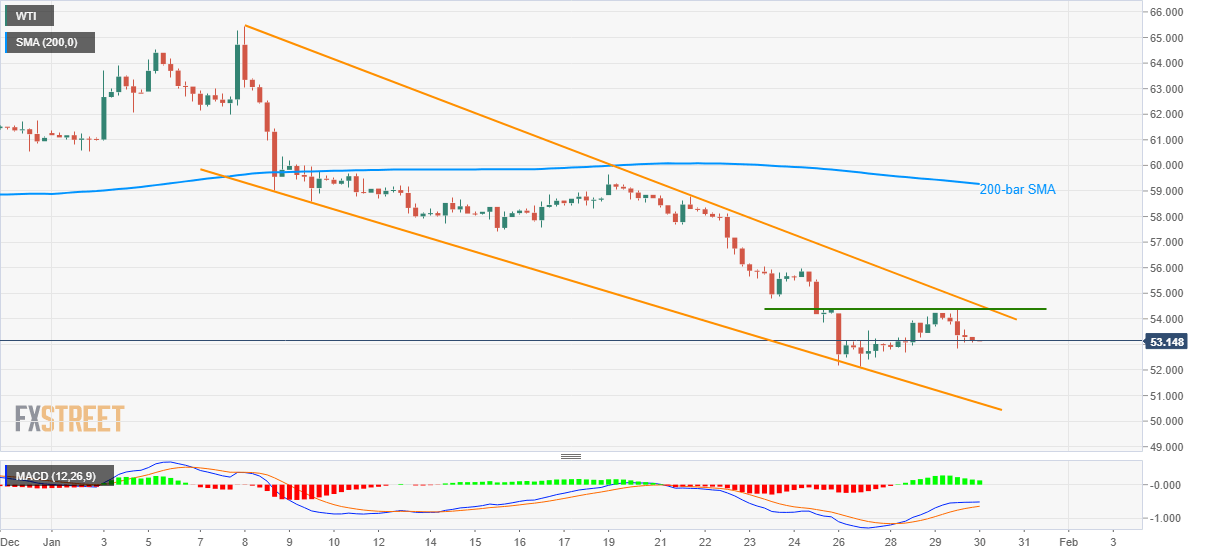
WTI four hour chart

Trend: Bearish


Japan Foreign Bond Investment declined to ¥-551.9B in January 24 from previous ¥175.1B

Japan Foreign Bond Investment declined to ¥-551.9B in January 24 from previous ¥175.1B
Read more Previous

Growth and inflation to justify further FOMC easing from mid-year – Westpac

Following the US Federal Reserve’s January month monetary policy meeting, Westpac came out with its research expecting the key US catalysts to justify
Read more Next