Confirming you are not from the U.S. or the Philippines

By giving this statement, I explicitly declare and confirm that:
  • I am not a U.S. citizen or resident
  • I am not a resident of the Philippines
  • I do not directly or indirectly own more than 10% of shares/voting rights/interest of the U.S. residents and/or do not control U.S. citizens or residents by other means
  • I am not under the direct or indirect ownership of more than 10% of shares/voting rights/interest and/or under the control of U.S. citizen or resident exercised by other means
  • I am not affiliated with U.S. citizens or residents in terms of Section 1504(a) of FATCA
  • I am aware of my liability for making a false declaration.
For the purposes of this statement, all U.S. dependent countries and territories are equalled to the main territory of the USA. I accept full responsibility for the accuracy of this declaration and commit to personally address and resolve any claims or issues that may arise from a breach of this statement.
We are dedicated to your privacy and the security of your personal information. We only collect emails to provide special offers and important information about our products and services. By submitting your email address, you agree to receive such letters from us. If you want to unsubscribe or have any questions or concerns, write to our Customer Support.
Octa trading broker
Open trading account
Back

USD/INR Technical Analysis: 100-day EMA checks sellers near three-week low

  • USD/INR extends losses to the third day in a row.
  • 23.6% Fibonacci retracement, 200-day EMA act as additional supports.
  • Buyers will look for entry beyond 61.8% Fibonacci retracement.

USD/INR declines to 71.12, after printing the low of 71.05, ahead of the European open on Friday. The pair tests 100-day EMA amid bullish MACD, which in turn signal brighter chances of the pair’s recovery.

In doing so, 50% Fibonacci retracement level of September-December fall, at 71.48 will be the immediate choice of buyers during the recovery. However, the pair’s further gains will be restricted by 61.8% Fibonacci retracement around 71.75.

In a case where USD/INR manages to stay positive beyond 71.75, the Bulls can take the reins to cross 72.00 while targeting September 2019 high of 72.63.

Alternatively, pair’s daily closing below 100-day EMA level of 71.10 can push prices further down to 23.6% Fibonacci retracement and 200-day EMA, near 70.86 and 70.72 respectively.

If the bears keep dominating past-70.72, December month bottom near 70.32 and 70.00 round-figure will return to the chart.

USD/INR daily chart

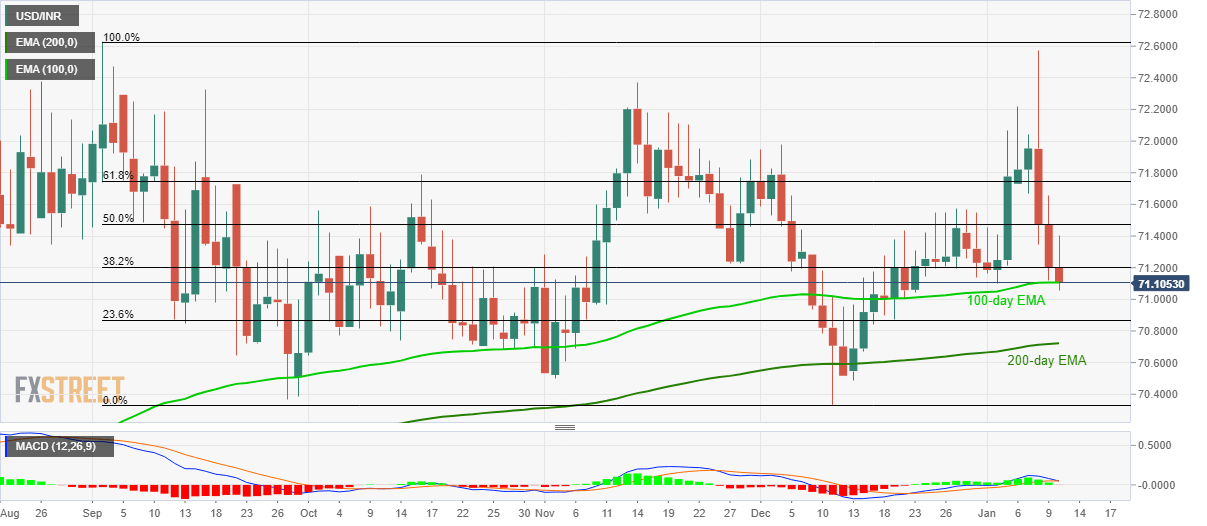
Trend: Pullback expected


GBP/USD consolidates losses amid pre-NFP lull

GBP/USD recovers the latest losses while taking the bids to 1.3080 ahead of the London open on Friday. The pair dropped the previous day after the BOE
Read more Previous

US Dollar Index looks flat around 97.40, Payrolls in sight

The greenback is trading within a sideline theme in the 97.40 region so far at the end of the week when gauged by the US Dollar Index (DXY). US Dollar
Read more Next