Confirming you are not from the U.S. or the Philippines

By giving this statement, I explicitly declare and confirm that:
  • I am not a U.S. citizen or resident
  • I am not a resident of the Philippines
  • I do not directly or indirectly own more than 10% of shares/voting rights/interest of the U.S. residents and/or do not control U.S. citizens or residents by other means
  • I am not under the direct or indirect ownership of more than 10% of shares/voting rights/interest and/or under the control of U.S. citizen or resident exercised by other means
  • I am not affiliated with U.S. citizens or residents in terms of Section 1504(a) of FATCA
  • I am aware of my liability for making a false declaration.
For the purposes of this statement, all U.S. dependent countries and territories are equalled to the main territory of the USA. I accept full responsibility for the accuracy of this declaration and commit to personally address and resolve any claims or issues that may arise from a breach of this statement.
We are dedicated to your privacy and the security of your personal information. We only collect emails to provide special offers and important information about our products and services. By submitting your email address, you agree to receive such letters from us. If you want to unsubscribe or have any questions or concerns, write to our Customer Support.
Octa trading broker
Open trading account
Back

USD/JPY Technical Analysis: Weekly close beyond 109.70/75 will be a call to bulls

  • USD/JPY trades positive near the two-week high, on a five-day winning streak.
  • Bullish engulfing on the weekly chart confronts 109.48/52 resistance confluence.
  • 200-week SMA adds to the resistance.

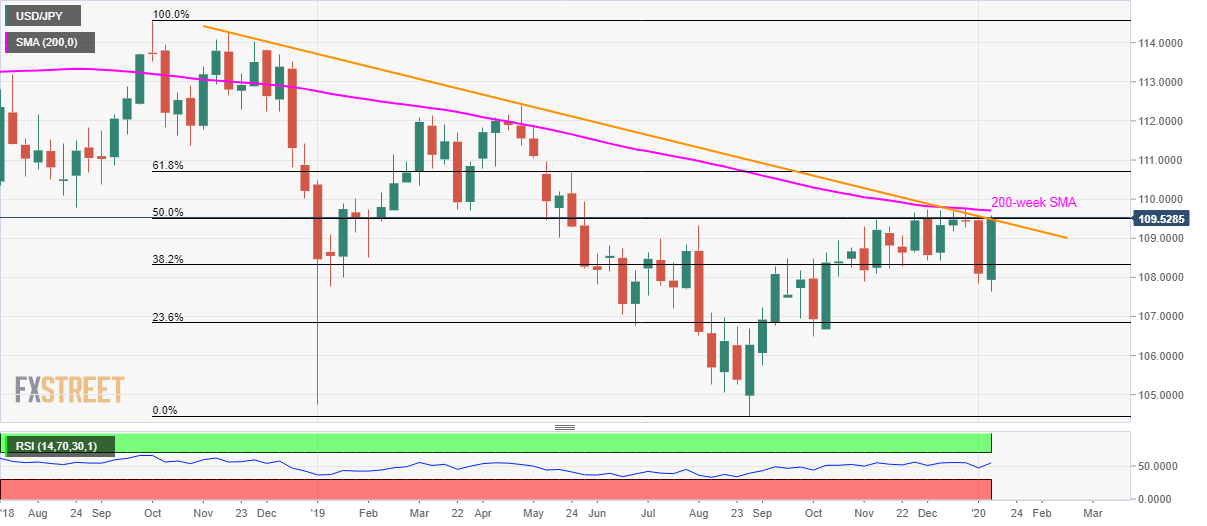
USD/JPY takes the bids to 109.55 during the initial trading session on Friday. In doing so, the pair registers a bullish candlestick formation on the weekly chart that currently confronts the key resistance confluence.

In addition to 109.48/52 area including 50% Fibonacci retracement of October 2018 top to August 2019 low and a downward sloping trend line since November 2018, 200-week SMA around 109.70/75 also challenges the buyers.

If at all USD/JPY prices register a weekly closing beyond 109.75, it confirms the bullish engulfing candlestick pattern on the chart while also the bulls to aim for the late-May top near 110.00.

Following that, 61.8% Fibonacci retracement level of 110.70 and April 2019 high of 112.40 will lure the buyers.

On the downside, pair’s declines below 108.45/40 hold the key to 108.00 and 107.50 support levels. However, the pair’s drop beneath 107.50 might not refrain from dragging the quote to the sub-107.00 region.

USD/JPY weekly chart

Trend: Bullish


BI Survey: Indonesia's Retail Sales rise 1.3% YoY in Nov, Rupiah at 21-month highs

Indonesia's Retail Sales grew by 1.3% on the year in November vs. a 3.6% jump seen in October, the latest survey conducted by Bank Indonesia (BI), the
Read more Previous

India: Increase in headline inflation to bring an end to easing cycle – Capital Economics

In their latest client note, analysts at Capital Economics note that India’s headline retail inflation likely accelerated to a five-year high in Decem
Read more Next