Confirming you are not from the U.S. or the Philippines
By giving this statement, I explicitly declare and confirm that:
I am not a U.S. citizen or resident
I am not a resident of the Philippines
I do not directly or indirectly own more than 10% of shares/voting rights/interest of the U.S. residents and/or do not control U.S. citizens or residents by other means
I am not under the direct or indirect ownership of more than 10% of shares/voting rights/interest and/or under the control of U.S. citizen or resident exercised by other means
I am not affiliated with U.S. citizens or residents in terms of Section 1504(a) of FATCA
I am aware of my liability for making a false declaration.
For the purposes of this statement, all U.S. dependent countries and territories are equalled to the main territory of the USA. I accept full responsibility for the accuracy of this declaration and commit to personally address and resolve any claims or issues that may arise from a breach of this statement.
We are dedicated to your privacy and the security of your personal information. We only collect emails to provide special offers and important information about our products and services. By submitting your email address, you agree to receive such letters from us. If you want to unsubscribe or have any questions or concerns, write to our Customer Support.
GBP/USD technical analysis: Cable battling with the 1.2200 level near daily lows
GBP/USD is trading off the August high after hitting the 1.2310 level on Tuesday.
The levels to beat for bears are seen at 1.2179, followed by 1.2156 support levels.
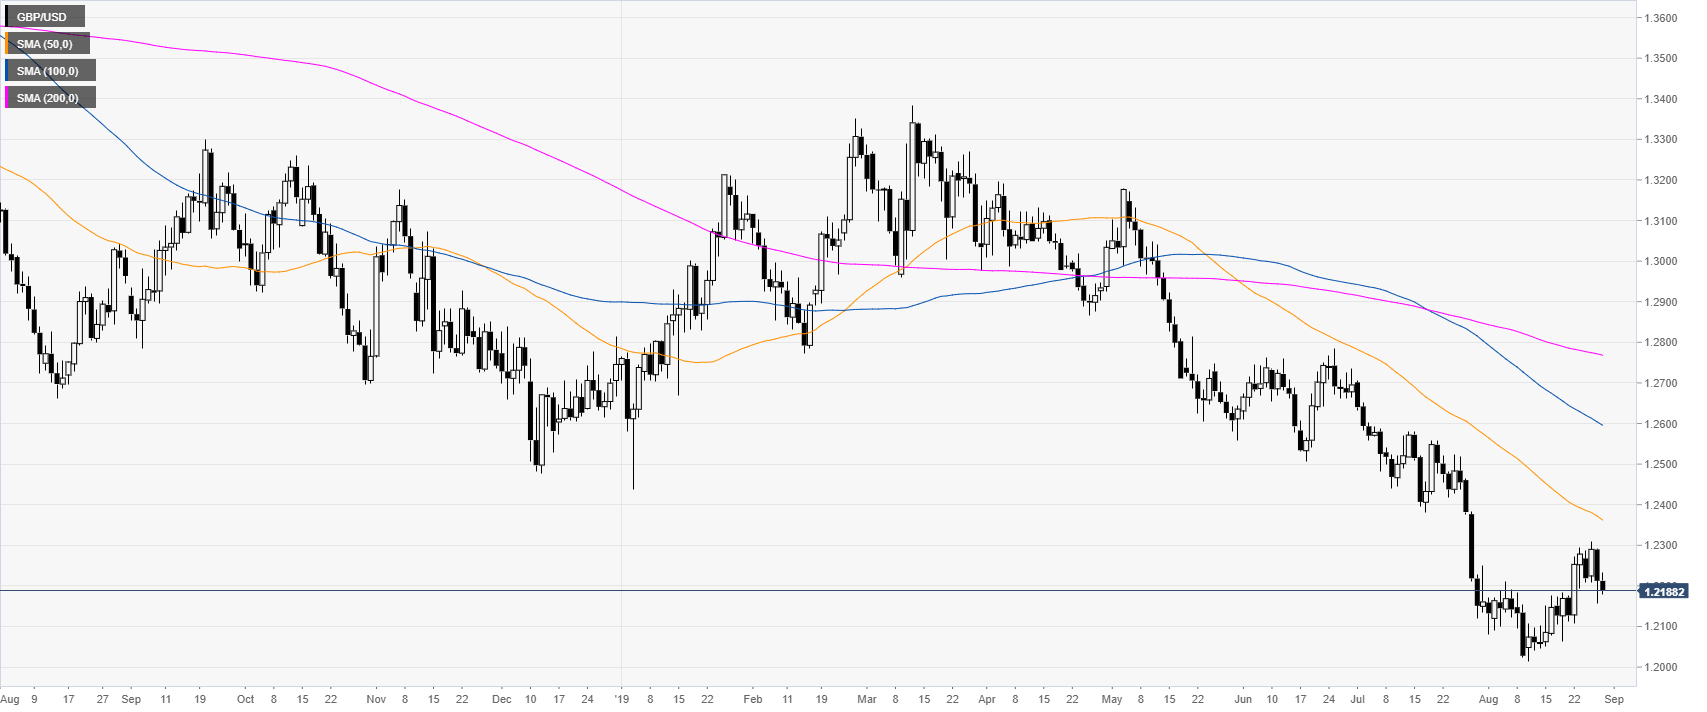
GBP/USD daily chart
The Sterling is in a bear trend below its main daily simple moving averages (SMAs). The market is down for the second day in a row.
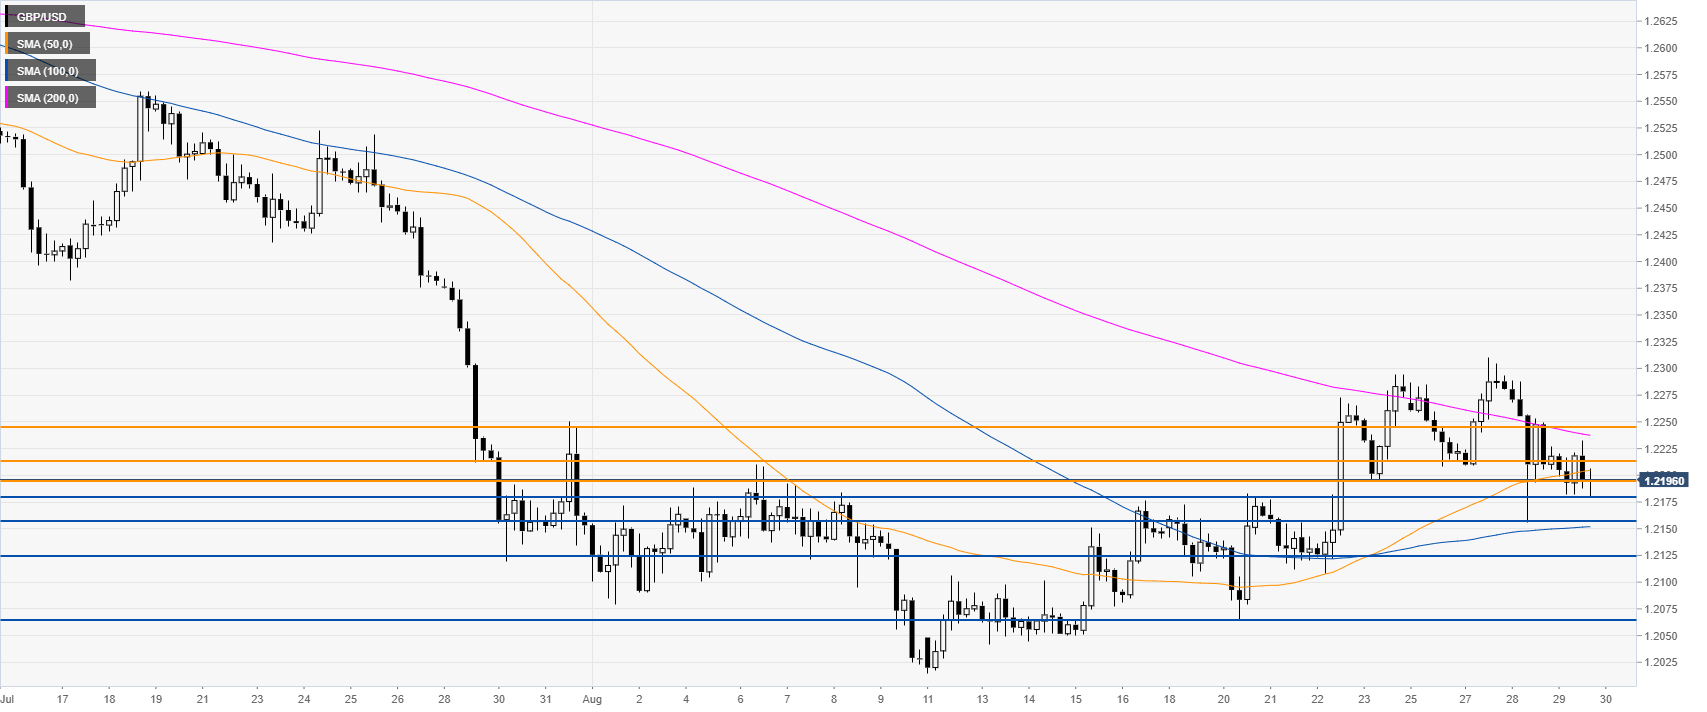
GBP/USD 4-hour chart
The Cable is trading below 1.2214 resistance and the 50/200 SMAs on the 4-hour time frame. Bears are most likely looking for a breakdown below 1.2179 support as well as the 1.2156, 1.2125 and 1.2065 levels, according to the Technical Confluences Indicator.
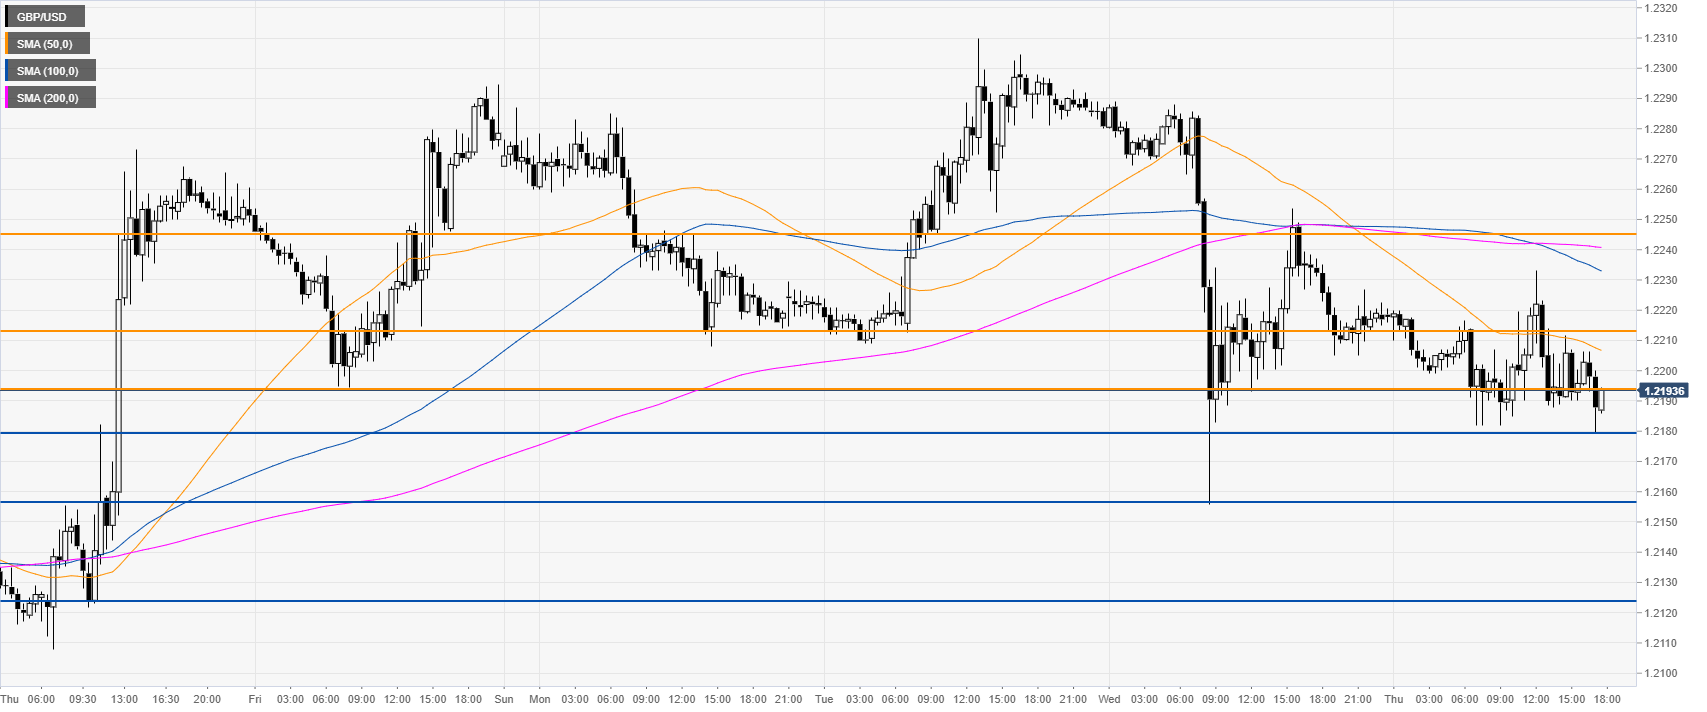
GBP/USD 30-minute chart
GBP/USD is trading below the main SMAs, suggesting a bearish bias in the near term. Immediate resistances are seen at the 1.2194, 1.2214 and 1.2245 levels, according to the Technical Confluences Indicator.
Additional key levels
Sign up and start trading
Create a free trading account and join millions of satisfied traders.

 About platform