Confirming you are not from the U.S. or the Philippines

By giving this statement, I explicitly declare and confirm that:
  • I am not a U.S. citizen or resident
  • I am not a resident of the Philippines
  • I do not directly or indirectly own more than 10% of shares/voting rights/interest of the U.S. residents and/or do not control U.S. citizens or residents by other means
  • I am not under the direct or indirect ownership of more than 10% of shares/voting rights/interest and/or under the control of U.S. citizen or resident exercised by other means
  • I am not affiliated with U.S. citizens or residents in terms of Section 1504(a) of FATCA
  • I am aware of my liability for making a false declaration.
For the purposes of this statement, all U.S. dependent countries and territories are equalled to the main territory of the USA. I accept full responsibility for the accuracy of this declaration and commit to personally address and resolve any claims or issues that may arise from a breach of this statement.
We are dedicated to your privacy and the security of your personal information. We only collect emails to provide special offers and important information about our products and services. By submitting your email address, you agree to receive such letters from us. If you want to unsubscribe or have any questions or concerns, write to our Customer Support.
Octa trading broker
Open trading account
Back

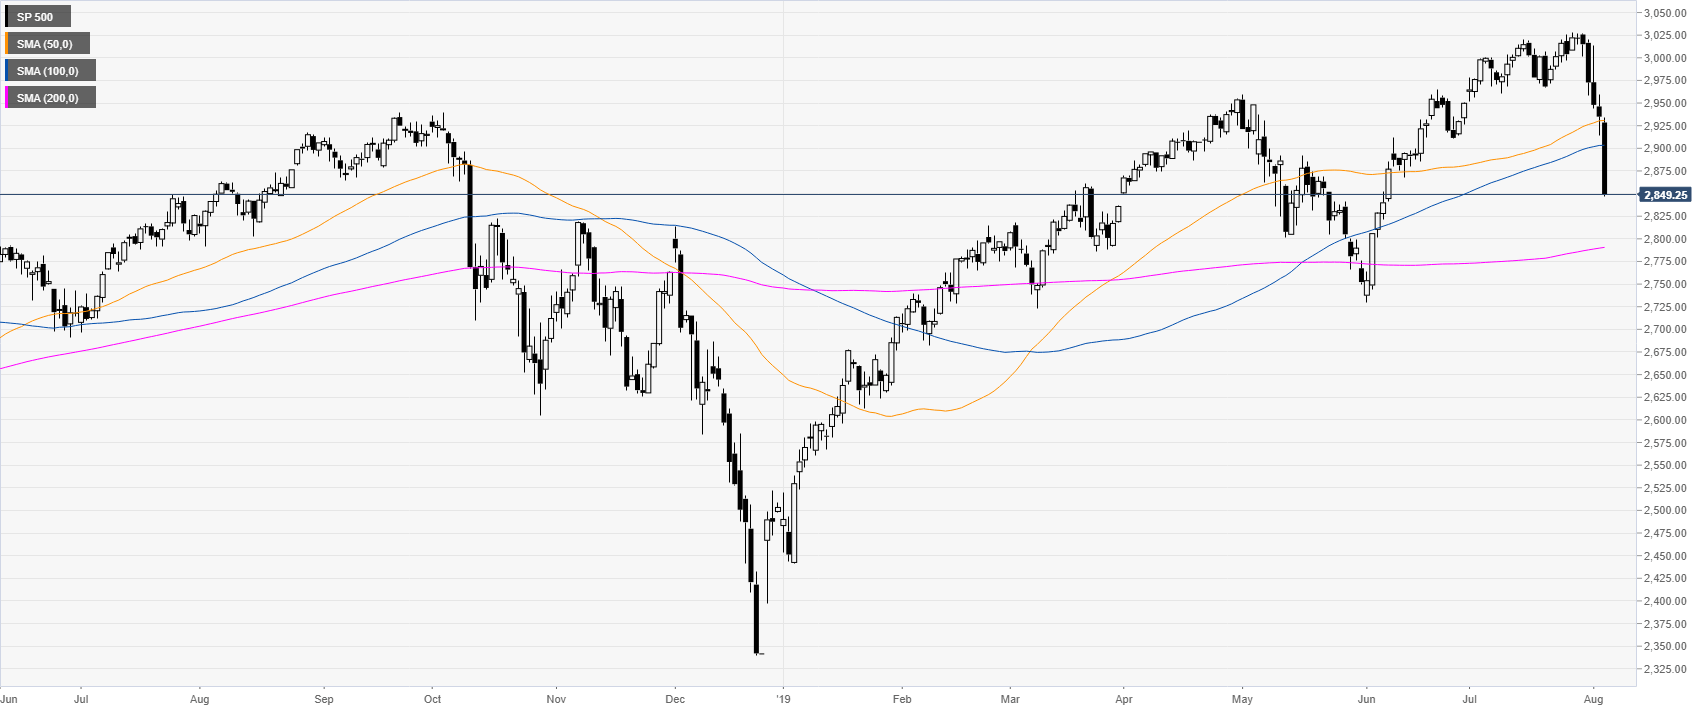
S&P 500 Index technical analysis: Big bears shed blood in the Street as the trade war is taking its toll

  • The S&P500 is in free fall as the trade war is sending Wall Street into a frenzy.
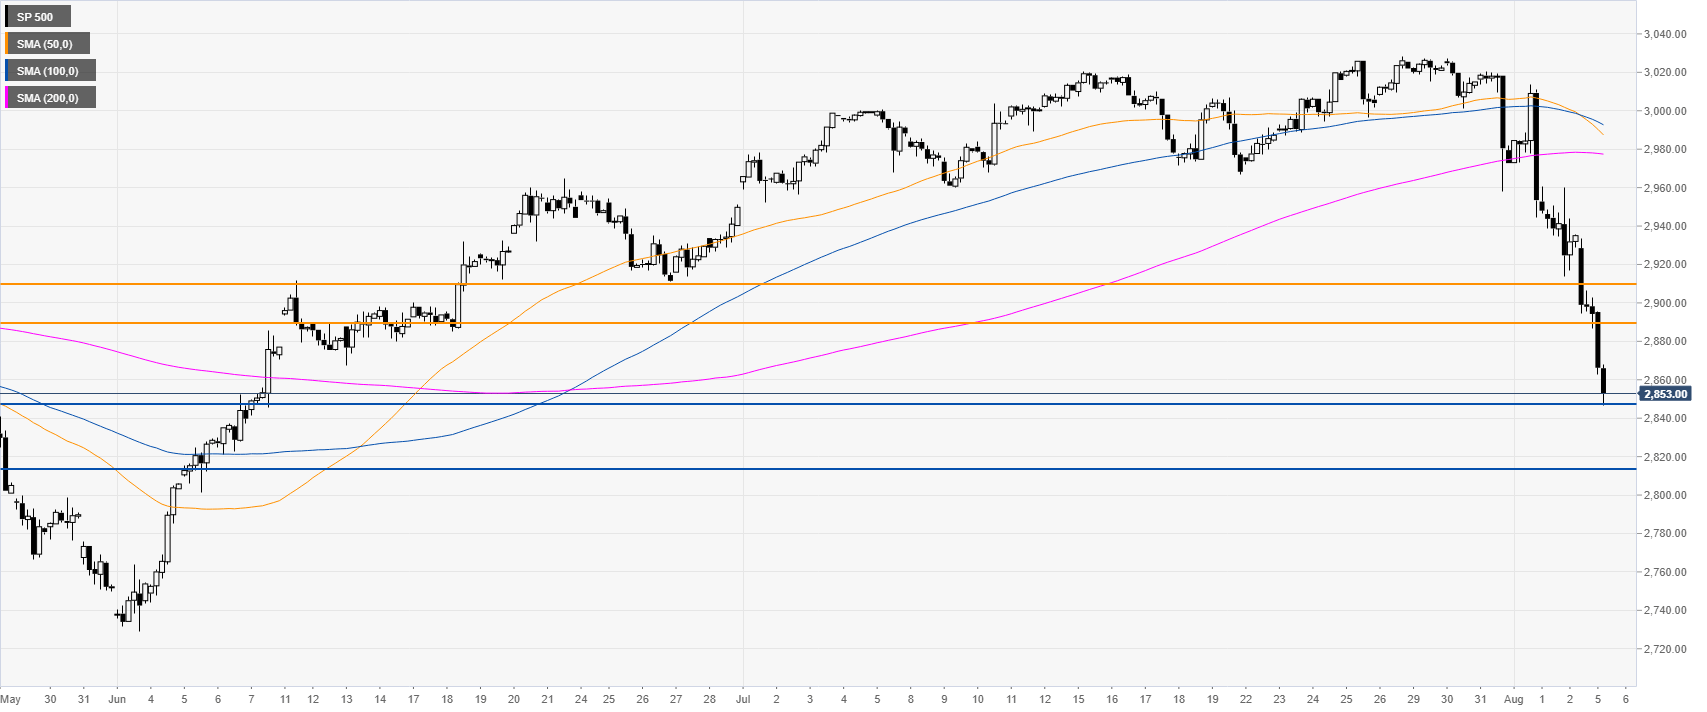
  • The level to beat for bears are seen at the 2,847.00 and 2,813.00 levels. 
 

S&P500 daily chart

 
The S&P 500 Index is having a steep correction down as the market is trading below the 50 and 100-day simple moving averages (DSMAs). The US-China trade war is sending US stock market into panic mode.
 

S&P500 4-hour chart

 
The market is having a vertical move down while slicing through many support levels and below the main SMAs. The bears are in control and their goal is to probably break below 2,847.00 to reach the 2,813.00 level.
 

S&P500 4-hour chart

 
The index is trading below its main SMAs, suggesting bearish momentum in the near term. Resistances can be located near the 2,890.00 and 2,910.00 levels. 

Additional key levels


Trump tweets his frustrations with China's Yuan manipulation

President Donald Trump has been tweeting about China and the fix in the USD/CNY overnight above 6.9000, the weakest level since November 2018. The mar
Read more Previous

EUR/CHF: Risk-off and dovish ECB calls for SNB intervention – Danske Bank

According to analysts from Danske Banky, intervention from the Swiss National Bank (SNB) might be the only thing stopping EUR/CHF from falling deeply
Read more Next