Confirming you are not from the U.S. or the Philippines

By giving this statement, I explicitly declare and confirm that:
  • I am not a U.S. citizen or resident
  • I am not a resident of the Philippines
  • I do not directly or indirectly own more than 10% of shares/voting rights/interest of the U.S. residents and/or do not control U.S. citizens or residents by other means
  • I am not under the direct or indirect ownership of more than 10% of shares/voting rights/interest and/or under the control of U.S. citizen or resident exercised by other means
  • I am not affiliated with U.S. citizens or residents in terms of Section 1504(a) of FATCA
  • I am aware of my liability for making a false declaration.
For the purposes of this statement, all U.S. dependent countries and territories are equalled to the main territory of the USA. I accept full responsibility for the accuracy of this declaration and commit to personally address and resolve any claims or issues that may arise from a breach of this statement.
We are dedicated to your privacy and the security of your personal information. We only collect emails to provide special offers and important information about our products and services. By submitting your email address, you agree to receive such letters from us. If you want to unsubscribe or have any questions or concerns, write to our Customer Support.
Octa trading broker
Open trading account
Back

S&P500 Index technical analysis: US stocks ends Tuesday in the green near the 2,980 level

  • The S&P500 is up on the day close to 2,895 resistance. 
  • Immediate supports are seen at the 2,965 and 2,950 levels. 

S&P500 daily chart

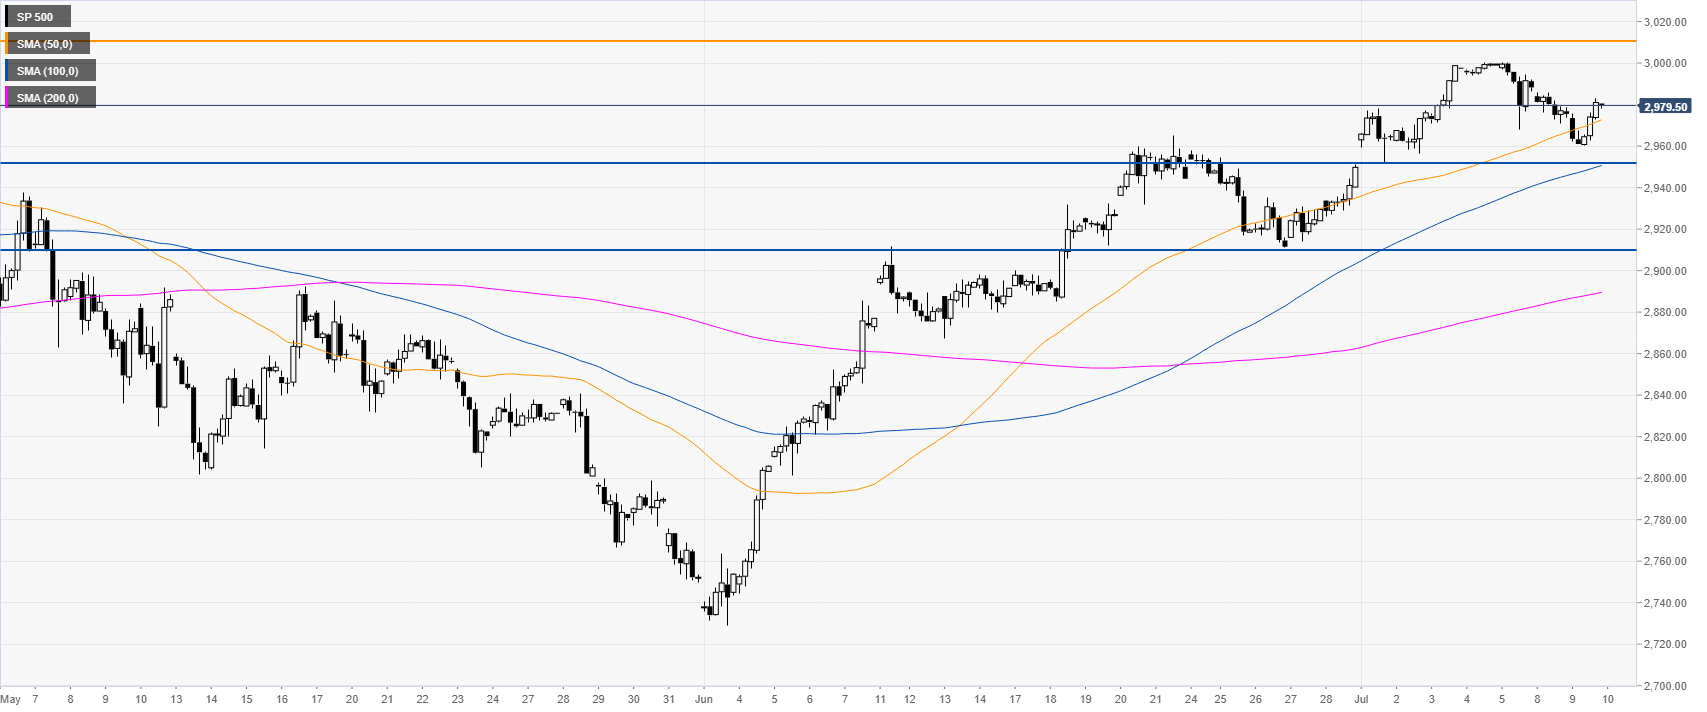
The S&P500 is retreating below the 3,000 handle. Bulls want to break above this level to continue to travel towards the 3,010 and 3,045 level.


S&P500 4-hour chart

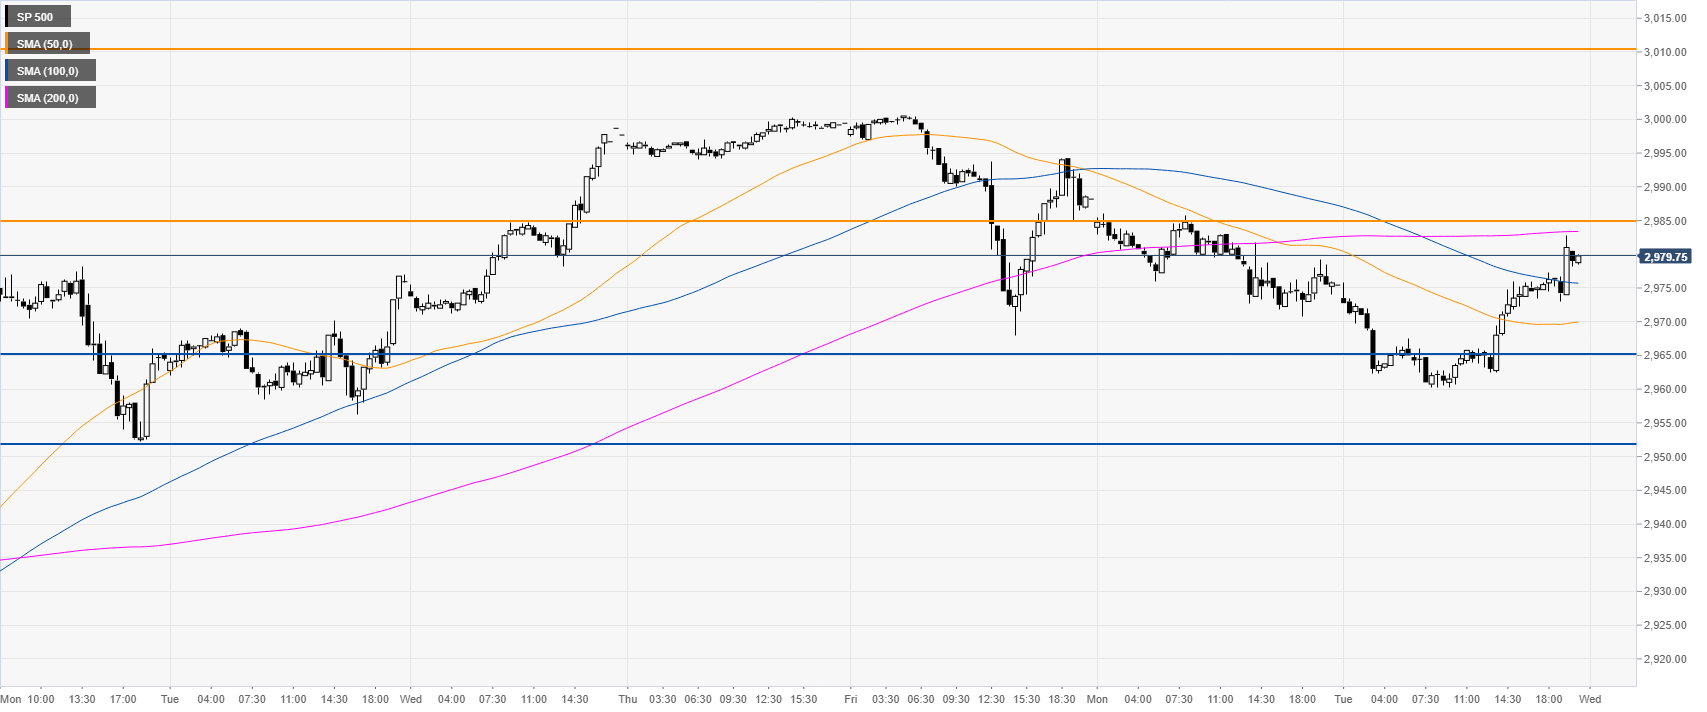
The market is finding some support above 2,950 and the 50 SMA. The index is trading above its main simple moving averages (SMAs) suggesting bullish momentum in the medium term. 

S&P500 30-minute chart

The S&P500 is about to test the 2,985 resistance and the 200 SMA. A bullish failure would lead to 2,965 key support and the 2,950 level. Further down lies 2,910 which can can become the next support.


Additional key levels


US Dollar Index technical analysis: Greenback grinding up and challenging 97.55 resistance

The US Dollar Index (DXY) is trading in a bull trend just above its main daily simple moving average (DSMA). The market is about to close the day just
Read more Previous

United States API Weekly Crude Oil Stock declined to -8.129M in July 5 from previous -5M

United States API Weekly Crude Oil Stock declined to -8.129M in July 5 from previous -5M
Read more Next