
Our best spreads and conditions
 About platform

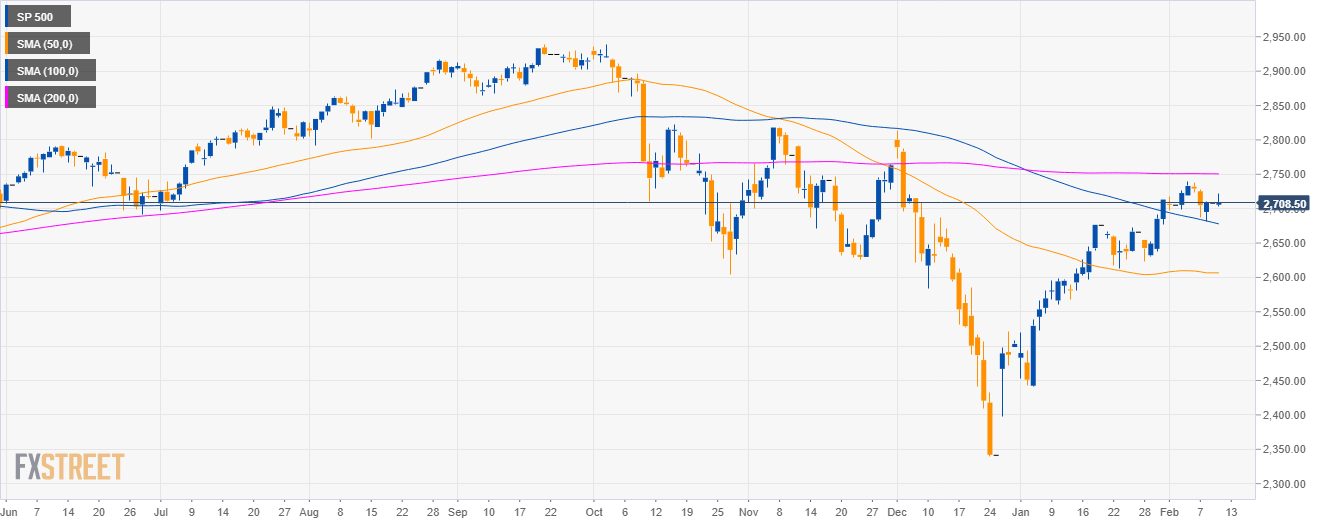
S&P500 daily chart
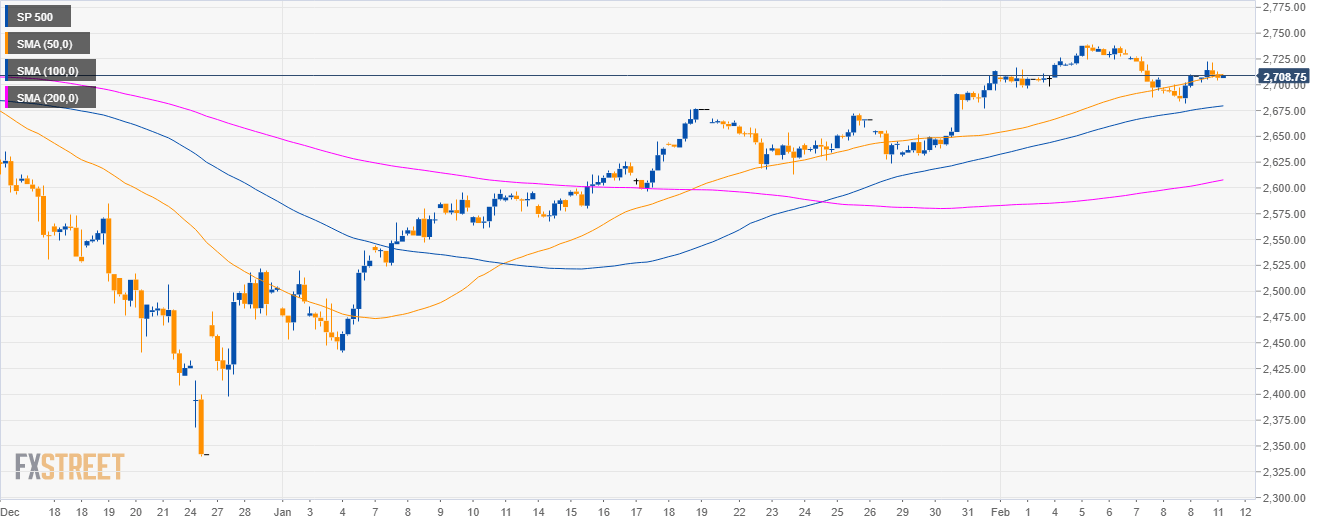
S&P500 4-hour chart
S&P500 30-minute chart
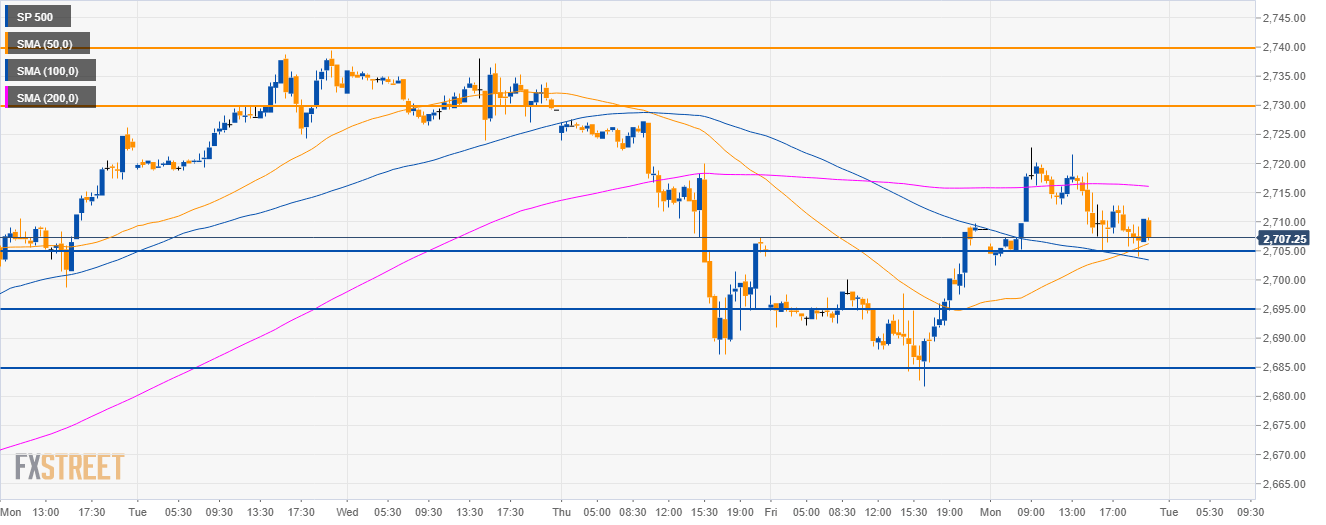
Additional key levels
SP 500
Overview:
Today Last Price: 2710.5
Today Daily change %: 0.06%
Today Daily Open: 2708.75
Trends:
Daily SMA20: 2683.38
Daily SMA50: 2606.74
Daily SMA100: 2680
Daily SMA200: 2750.66
Levels:
Previous Daily High: 2708.75
Previous Daily Low: 2708.75
Previous Weekly High: 2739.5
Previous Weekly Low: 2681.75
Previous Monthly High: 2714
Previous Monthly Low: 2441
Daily Fibonacci 38.2%: 2708.75
Daily Fibonacci 61.8%: 2708.75
Daily Pivot Point S1: 2708.75
Daily Pivot Point S2: 2708.75
Daily Pivot Point S3: 2708.75
Daily Pivot Point R1: 2708.75
Daily Pivot Point R2: 2708.75
Daily Pivot Point R3: 2708.75


