
Our best spreads and conditions
 About platform

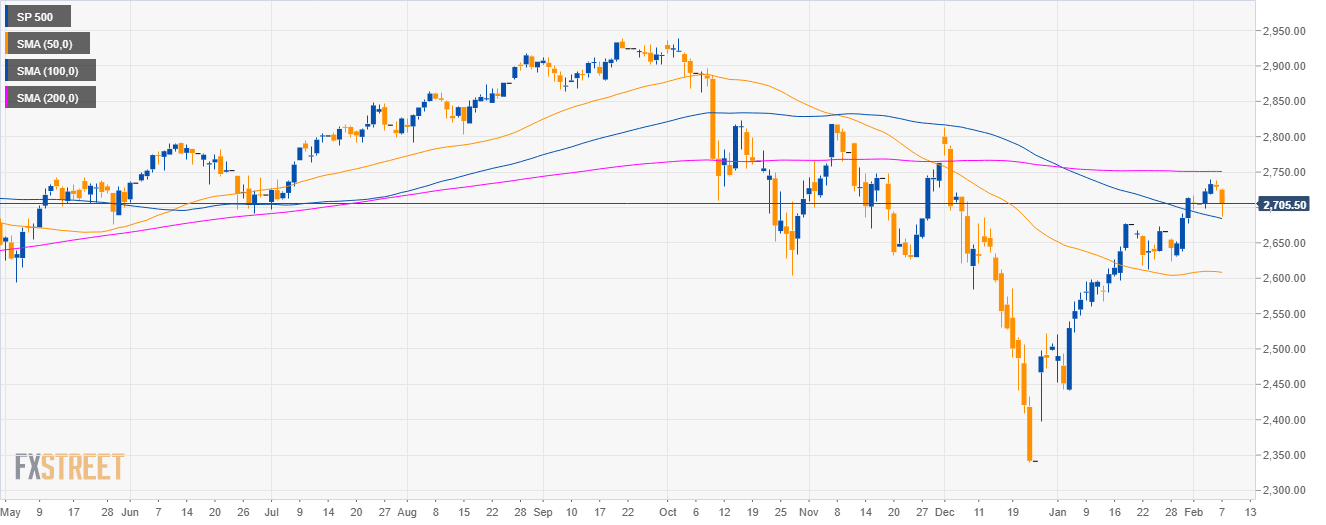
S&P500 daily chart
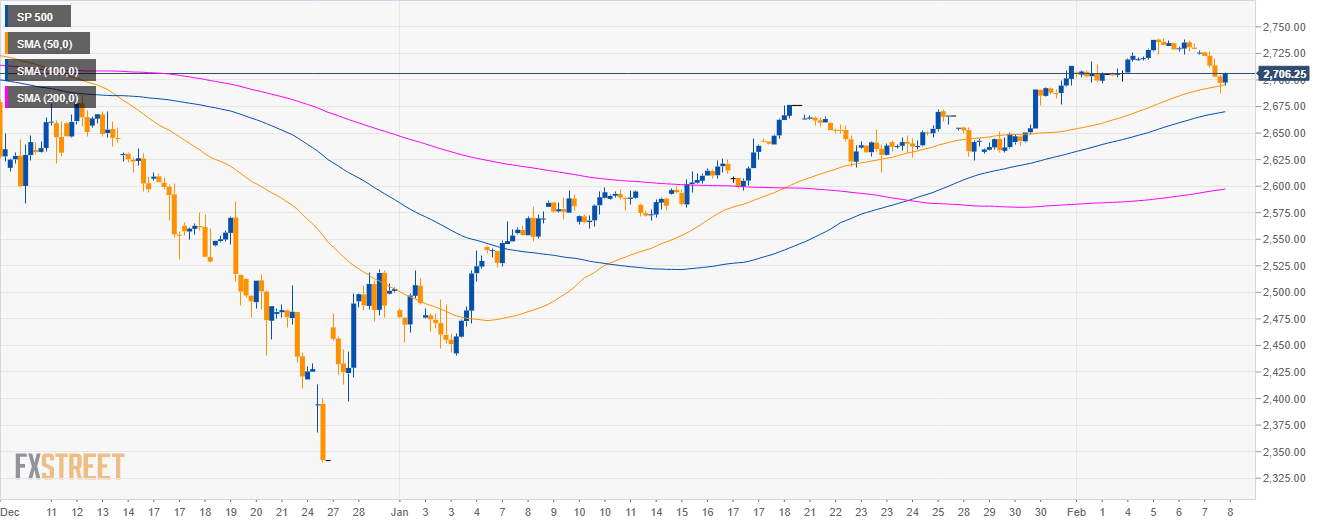
S&P500 4-hour chart
S&P500 30-minute chart
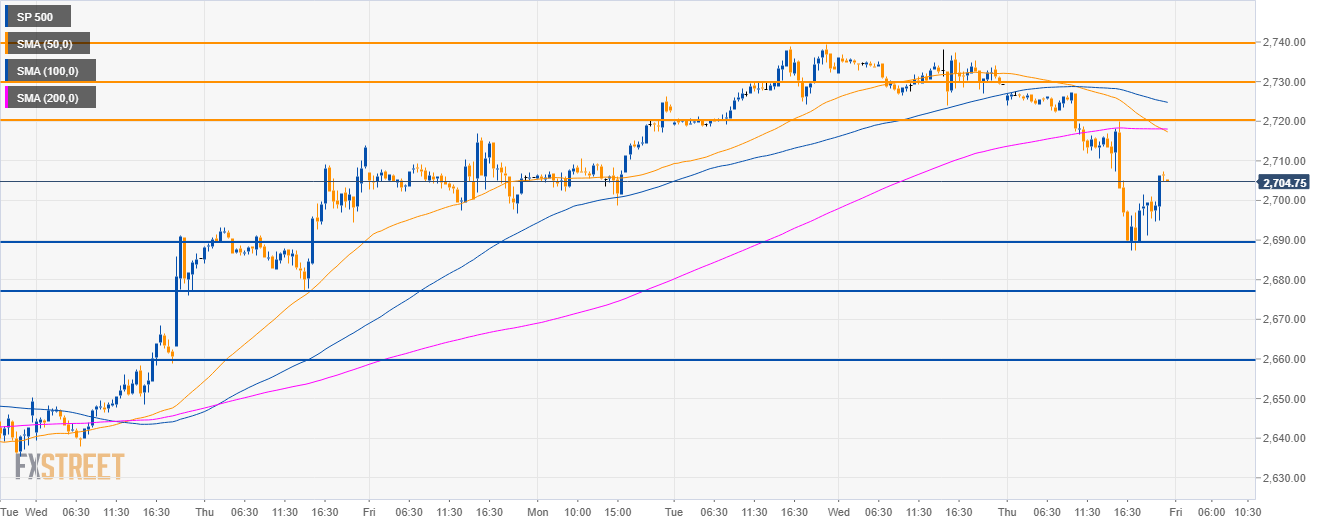
Additional key levels
SP 500
Overview:
Today Last Price: 2706.25
Today Daily change: -23.00 points
Today Daily change %: -0.84%
Today Daily Open: 2729.25
Trends:
Daily SMA20: 2670.18
Daily SMA50: 2609.37
Daily SMA100: 2686.33
Daily SMA200: 2750.95
Levels:
Previous Daily High: 2738
Previous Daily Low: 2724
Previous Weekly High: 2717
Previous Weekly Low: 2623.75
Previous Monthly High: 2714
Previous Monthly Low: 2441
Daily Fibonacci 38.2%: 2729.35
Daily Fibonacci 61.8%: 2732.65
Daily Pivot Point S1: 2722.83
Daily Pivot Point S2: 2716.42
Daily Pivot Point S3: 2708.83
Daily Pivot Point R1: 2736.83
Daily Pivot Point R2: 2744.42
Daily Pivot Point R3: 2750.83


