Confirming you are not from the U.S. or the Philippines

By giving this statement, I explicitly declare and confirm that:
  • I am not a U.S. citizen or resident
  • I am not a resident of the Philippines
  • I do not directly or indirectly own more than 10% of shares/voting rights/interest of the U.S. residents and/or do not control U.S. citizens or residents by other means
  • I am not under the direct or indirect ownership of more than 10% of shares/voting rights/interest and/or under the control of U.S. citizen or resident exercised by other means
  • I am not affiliated with U.S. citizens or residents in terms of Section 1504(a) of FATCA
  • I am aware of my liability for making a false declaration.
For the purposes of this statement, all U.S. dependent countries and territories are equalled to the main territory of the USA. I accept full responsibility for the accuracy of this declaration and commit to personally address and resolve any claims or issues that may arise from a breach of this statement.
We are dedicated to your privacy and the security of your personal information. We only collect emails to provide special offers and important information about our products and services. By submitting your email address, you agree to receive such letters from us. If you want to unsubscribe or have any questions or concerns, write to our Customer Support.
Octa trading broker
Open trading account
Back

USD/JPY Technical Analysis: Sellers continue to lurk ahead of 110.00

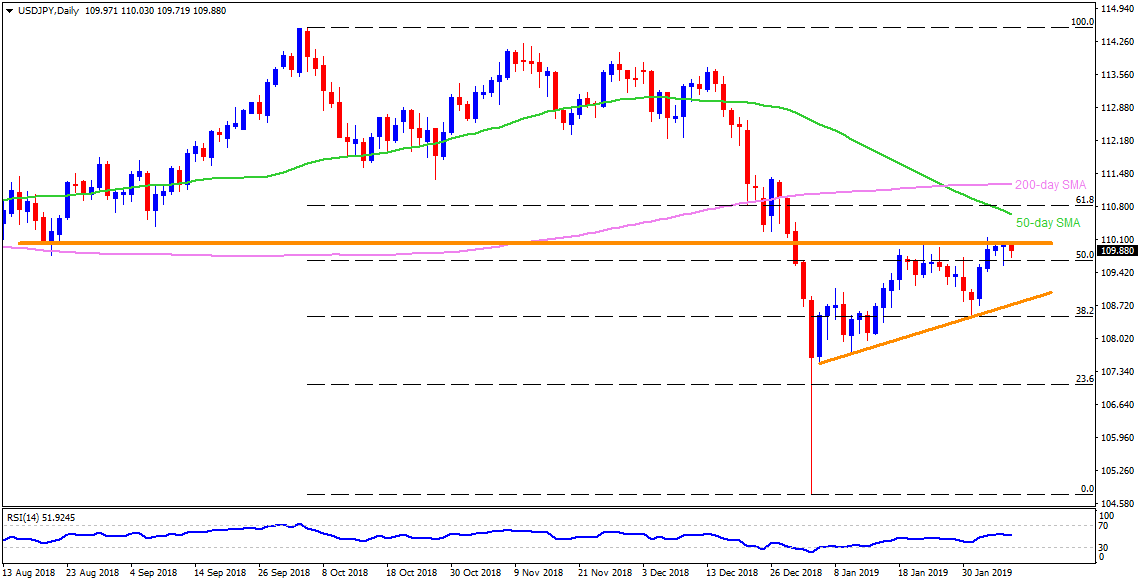
USD/JPY daily chart

  • A horizontal-line connecting August 2018 closing lows to the highs marked during 2019 so far restricts USD/JPY upside around 110.00 on early Thursday.
  • As a result, chances of the pair’s pullback to the 109.10 and then to the 108.70 support-line can’t be denied.
  • On the flip side, a daily closing beyond 110.00 can trigger an upside towards 50-day simple moving average (SMA) level of 110.65 prior to highlighting 111.25, including 200-day SMA, as resistance.
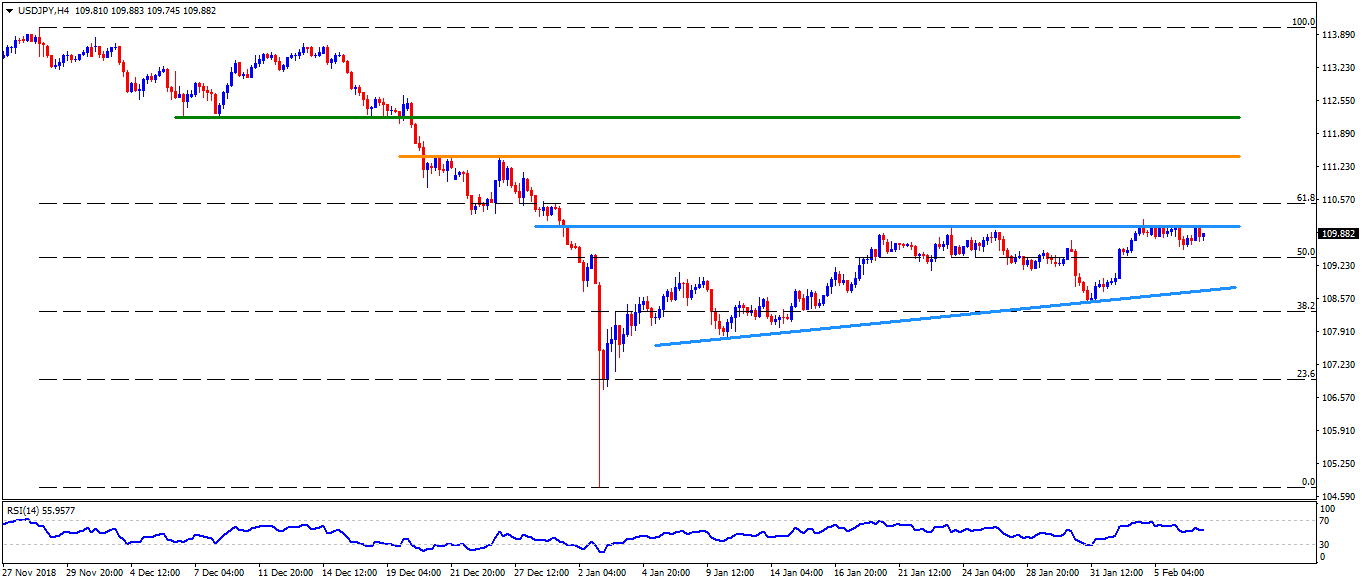
USD/JPY 4-hour chart

  • On the shorter time frame, 109.50 can offer immediate support ahead of shifting focus to the 109.10 and then to the 108.70.
  • If there prevail additional downside pressure after 108.70, then 108.50 and 107.70 could regain market attention.
  • Meanwhile, 61.8% Fibonacci Retracement of its recent declines, around 110.50, acts as adjacent resistance for the pair once it clears the 110.00 barrier.
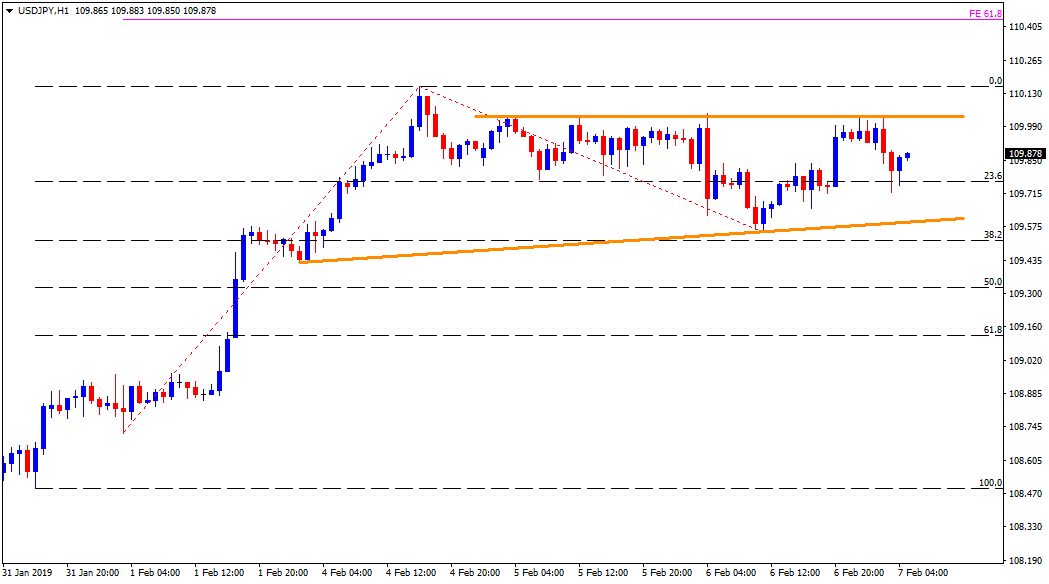
USD/JPY Hourly chart

  • The 109.60 and the 110.00 restricts the pair’s near-term moves with 109.50 and the 110.15 being follow-on levels to observe on either side breaks.
  • The 61.8% Fibonacci expansion on latest pullback, at 110.45 can please buyers after 110.15 while 109.50 and 109.10 seem sellers’ bets past-109.60.
USD/INR Technical Analysis: 100-day MA is key resistance

The USD/INR pair closed at 71.44 on Feb. 1, confirming a bull flag breakout. The 100-day moving average (MA), however, has put the brakes on the post-
Read more Previous

White House Chief of staff Mulvaney: Will figure out wall if Congress says no - Fox

Acting White House chief of staff Mick Mulvaney is out on the wires reiterating that President Trump will figure out ways to construct a wall across M
Read more Next