Confirming you are not from the U.S. or the Philippines

By giving this statement, I explicitly declare and confirm that:
  • I am not a U.S. citizen or resident
  • I am not a resident of the Philippines
  • I do not directly or indirectly own more than 10% of shares/voting rights/interest of the U.S. residents and/or do not control U.S. citizens or residents by other means
  • I am not under the direct or indirect ownership of more than 10% of shares/voting rights/interest and/or under the control of U.S. citizen or resident exercised by other means
  • I am not affiliated with U.S. citizens or residents in terms of Section 1504(a) of FATCA
  • I am aware of my liability for making a false declaration.
For the purposes of this statement, all U.S. dependent countries and territories are equalled to the main territory of the USA. I accept full responsibility for the accuracy of this declaration and commit to personally address and resolve any claims or issues that may arise from a breach of this statement.
We are dedicated to your privacy and the security of your personal information. We only collect emails to provide special offers and important information about our products and services. By submitting your email address, you agree to receive such letters from us. If you want to unsubscribe or have any questions or concerns, write to our Customer Support.
Octa trading broker
Open trading account
Back

USD/INR Technical Analysis: 100-day MA is key resistance

The USD/INR pair closed at 71.44 on Feb. 1, confirming a bull flag breakout. The 100-day moving average (MA), however, has put the brakes on the post-breakout rally.

Daily chart
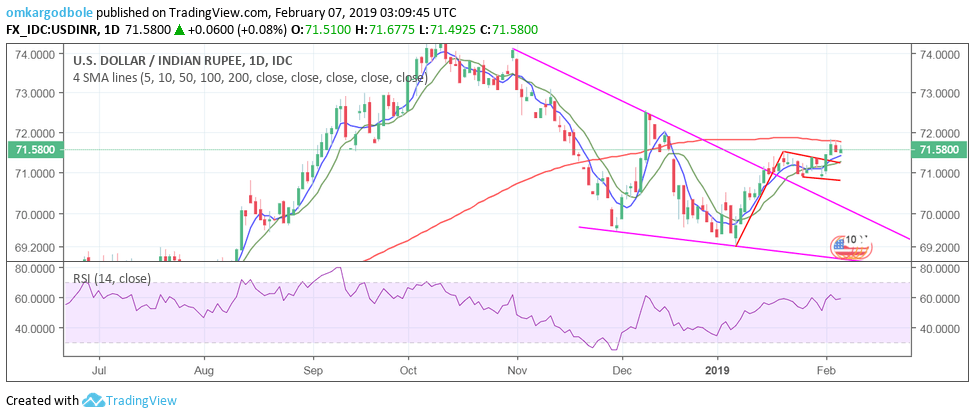
The back-to-back failure to penetrate the 100-day MA on a closing basis is a slight cause for concern. The outlook, however, remains bullish while the pair is held above the former resistance-turned-support of 71.38 (Jan. 29 high).

With 5- and 10-day moving averages (MAs) trending north, dips to 71.38, if any, could be short-lived.

A close above the 100-day MA of 71.78 would bolster the already bullish setup and open up upside toward 72.55. Note that the 14-day RSI is located at 58, meaning there is sufficient room for a convincing move above 72.00.

India' Nifty index has found acceptance above the crucial resistance of 11,000. The stocks, therefore, could remain better bid, providing some support to INR.

Trend: cautiously bullish

USD/INR

Overview:
    Today Last Price: 71.675
    Today Daily change: 0.0950 pips
    Today Daily change %: 0.13%
    Today Daily Open: 71.58
Trends:
    Daily SMA20: 71.1083
    Daily SMA50: 70.7616
    Daily SMA100: 71.7746
    Daily SMA200: 70.352
Levels:
    Previous Daily High: 71.78
    Previous Daily Low: 71.475
    Previous Weekly High: 71.64
    Previous Weekly Low: 70.82
    Previous Monthly High: 71.64
    Previous Monthly Low: 69.185
    Daily Fibonacci 38.2%: 71.6635
    Daily Fibonacci 61.8%: 71.5915
    Daily Pivot Point S1: 71.4433
    Daily Pivot Point S2: 71.3067
    Daily Pivot Point S3: 71.1383
    Daily Pivot Point R1: 71.7483
    Daily Pivot Point R2: 71.9167
    Daily Pivot Point R3: 72.0533


Ex-Fed Chair Yellen: Rate cuts, hikes both possible - WSJ

Former Federal Reserve Chairwoman Janet Yellen said that she lacks clarity on what the next Fed move on rates will be, in an interview with CNBC on We
Read more Previous

USD/JPY Technical Analysis: Sellers continue to lurk ahead of 110.00

USD/JPY daily chart A horizontal-line connecting August 2018 closing lows to the highs marked during 2019 so far restricts USD/JPY upside around 11
Read more Next