

Silver Price Forecast: XAG/USD rallies past 200 and 50-day SMAs
- Silver climbs, breaching 200-day SMA at $29.98, enhancing buying momentum.
- Major resistance at $31.00; break could aim for December 12 high of $32.32.
- Pullback below 50-day SMA might prompt retest of 200-day SMA, down to $28.74.
Silver's price stages a comeback, rising above the 50-day Simple Moving Average (SMA) at $30.32 and eyeing a break of the 100-day SMA. At the time of writing, the XAG/USD trades at $30.64, having gained over 2.64% on Wednesday.
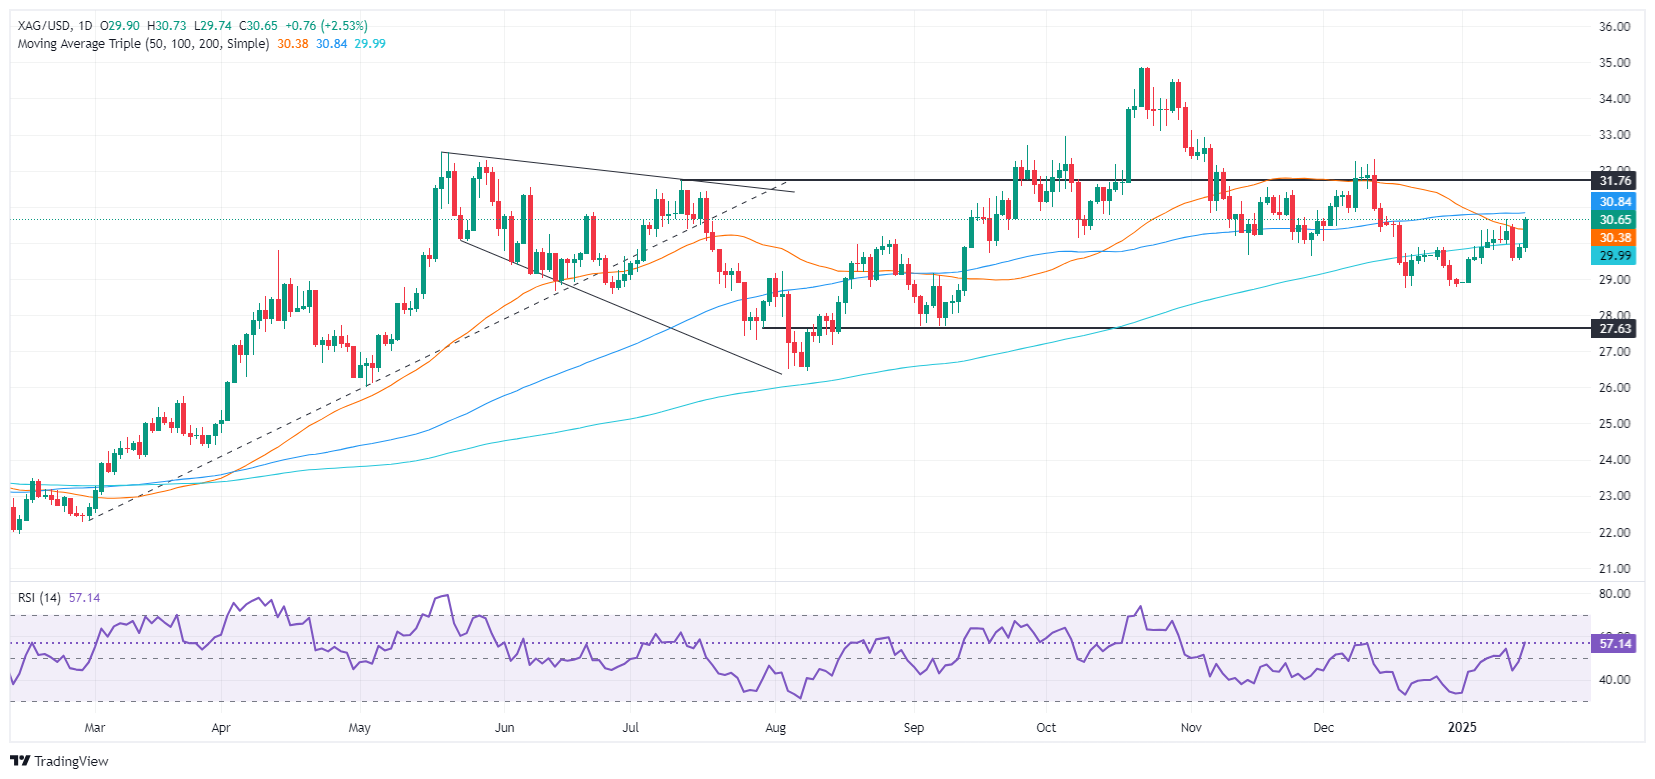
XAG/USD Price Forecast: Technical outlook
On its way toward its current price, XAG/USD cleared the 200-day SMA at $29.98, which exacerbated the upward move. Yet buyers need to clear the 100-day SMA at $30.82 so Silver can extend its gains.
Momentum favors further upside, yet consolidation lies ahead as the Relative Strength Index (RSI) is flat, but above the latest peak.
If buyers clear the 100-day SMA, $31.00 emerges as the next key resistance level. A break above this level opens the door to testing the latest cycle high at $32.32, the December 12 daily high.
On the other hand, if sellers step in and push XAG/USD below the 50-day SMA, it could pave the way towards $29.98, the 200-day SMA. On further weakness, the next stop would be December’s 19 swing low of $28.74.
XAG/USD Price Chart - Daily
Silver FAQs
Silver is a precious metal highly traded among investors. It has been historically used as a store of value and a medium of exchange. Although less popular than Gold, traders may turn to Silver to diversify their investment portfolio, for its intrinsic value or as a potential hedge during high-inflation periods. Investors can buy physical Silver, in coins or in bars, or trade it through vehicles such as Exchange Traded Funds, which track its price on international markets.
Silver prices can move due to a wide range of factors. Geopolitical instability or fears of a deep recession can make Silver price escalate due to its safe-haven status, although to a lesser extent than Gold's. As a yieldless asset, Silver tends to rise with lower interest rates. Its moves also depend on how the US Dollar (USD) behaves as the asset is priced in dollars (XAG/USD). A strong Dollar tends to keep the price of Silver at bay, whereas a weaker Dollar is likely to propel prices up. Other factors such as investment demand, mining supply – Silver is much more abundant than Gold – and recycling rates can also affect prices.
Silver is widely used in industry, particularly in sectors such as electronics or solar energy, as it has one of the highest electric conductivity of all metals – more than Copper and Gold. A surge in demand can increase prices, while a decline tends to lower them. Dynamics in the US, Chinese and Indian economies can also contribute to price swings: for the US and particularly China, their big industrial sectors use Silver in various processes; in India, consumers’ demand for the precious metal for jewellery also plays a key role in setting prices.
Silver prices tend to follow Gold's moves. When Gold prices rise, Silver typically follows suit, as their status as safe-haven assets is similar. The Gold/Silver ratio, which shows the number of ounces of Silver needed to equal the value of one ounce of Gold, may help to determine the relative valuation between both metals. Some investors may consider a high ratio as an indicator that Silver is undervalued, or Gold is overvalued. On the contrary, a low ratio might suggest that Gold is undervalued relative to Silver.