Confirming you are not from the U.S. or the Philippines

By giving this statement, I explicitly declare and confirm that:
  • I am not a U.S. citizen or resident
  • I am not a resident of the Philippines
  • I do not directly or indirectly own more than 10% of shares/voting rights/interest of the U.S. residents and/or do not control U.S. citizens or residents by other means
  • I am not under the direct or indirect ownership of more than 10% of shares/voting rights/interest and/or under the control of U.S. citizen or resident exercised by other means
  • I am not affiliated with U.S. citizens or residents in terms of Section 1504(a) of FATCA
  • I am aware of my liability for making a false declaration.
For the purposes of this statement, all U.S. dependent countries and territories are equalled to the main territory of the USA. I accept full responsibility for the accuracy of this declaration and commit to personally address and resolve any claims or issues that may arise from a breach of this statement.
We are dedicated to your privacy and the security of your personal information. We only collect emails to provide special offers and important information about our products and services. By submitting your email address, you agree to receive such letters from us. If you want to unsubscribe or have any questions or concerns, write to our Customer Support.
Back

EUR/GBP Price Analysis: Breakdown from multi-month range

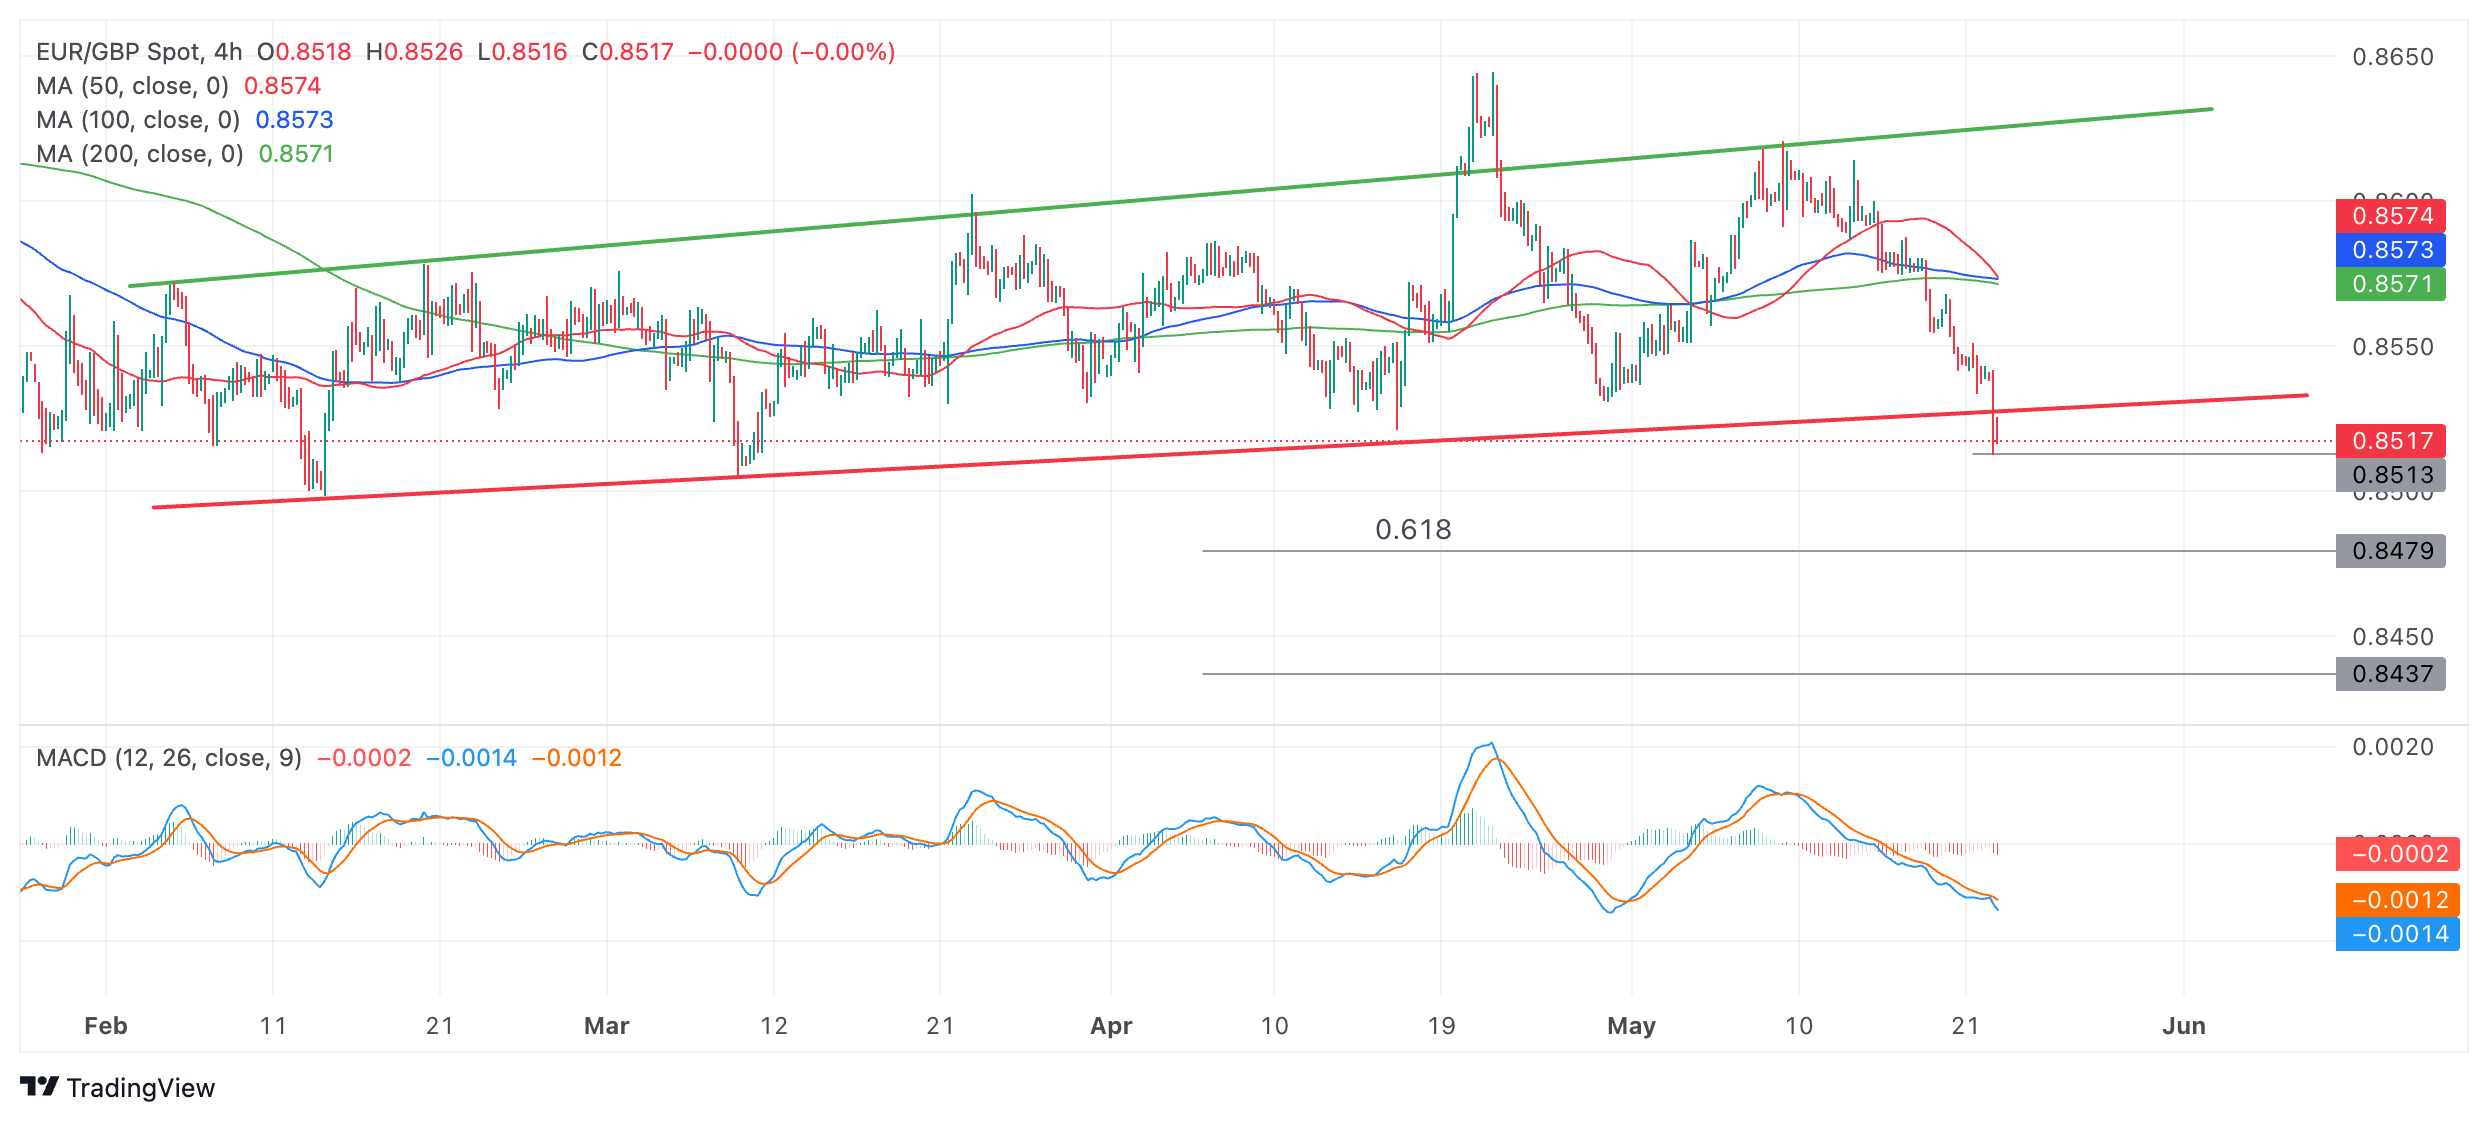
  • EUR/GBP is breaking down out of a multi-month range it has been oscillating within since February. 
  • If price holds below the range lows it could lead to a substantial extension lower. 
  • A break back above the highs of the breakout candle would indicate the break was false.

EUR/GBP has fallen to the floor of a multi-month range and broken decisively below on a 4-hour period closing basis. 

A close below the 0.8513 low of the candle that pierced through the floor would provide added confirmation of more downside. 

EUR/GBP 4-hour Chart 


The customary method for forecasting how far a breakout move will go is to take the height of the range and extrapolate it lower from the breakout point. This gives two targets: a conservative objective at the 0.618 Fibonacci ratio – and a more optimistic target at the full 100% of the height of the range extrapolated lower. 

The conservative target lies at roughly 0.8479 and the more optimistic objective at 0.8437. 

The Moving Average Convergence Divergence (MACD) indicator is in the negative zone and looking a little oversold. If it crosses back above the signal line it could signal a recovery. Crosses of the MACD above or below its signal line have been a reliable indicator of oscillations in price during the unfolding of the range. 

There is a risk the break is a “false break” and price will recover and move back up inside the range. EUR/GBP is, after all, in a sideways trend, and “the trend is your friend”. A close back above the 0.8542 high of the breakdown candle would provide evidence the sideways trend is probably extending further. It would suggest a strong possibility of a move back up to the range high in the 0.8620s.


NZD/USD Price Analysis: Surrenders majority of hawkish RBNZ-induced gains

The NZD/USD pair falls sharply to near the crucial support of 0.6100 in Wednesday’s European session.
Read more Previous

US Dollar consolidates further as markets gear up for increased volatility

The US Dollar (USD) is drifting as markets await a volatile 24 hours ahead which will commence with the release of the Federal Reserve (Fed) Minutes from the recent Federal Open Market Committee (FOMC) decision on why they kept rates stable.
Read more Next