Confirming you are not from the U.S. or the Philippines

By giving this statement, I explicitly declare and confirm that:
  • I am not a U.S. citizen or resident
  • I am not a resident of the Philippines
  • I do not directly or indirectly own more than 10% of shares/voting rights/interest of the U.S. residents and/or do not control U.S. citizens or residents by other means
  • I am not under the direct or indirect ownership of more than 10% of shares/voting rights/interest and/or under the control of U.S. citizen or resident exercised by other means
  • I am not affiliated with U.S. citizens or residents in terms of Section 1504(a) of FATCA
  • I am aware of my liability for making a false declaration.
For the purposes of this statement, all U.S. dependent countries and territories are equalled to the main territory of the USA. I accept full responsibility for the accuracy of this declaration and commit to personally address and resolve any claims or issues that may arise from a breach of this statement.
We are dedicated to your privacy and the security of your personal information. We only collect emails to provide special offers and important information about our products and services. By submitting your email address, you agree to receive such letters from us. If you want to unsubscribe or have any questions or concerns, write to our Customer Support.
Octa trading broker
Open trading account
Back

NZD/USD Price Analysis: Bearish forces persist, bulls challenged the 20-day SMA

  • The daily RSI reveals potential minor correction, indicating latent buying momentum.
  • The hourly indicators show fluctuating momentum, indicating a possible pause in the bearish impulse.
  • For bulls to make ground, they would need to assert above the 20-day SMAs.

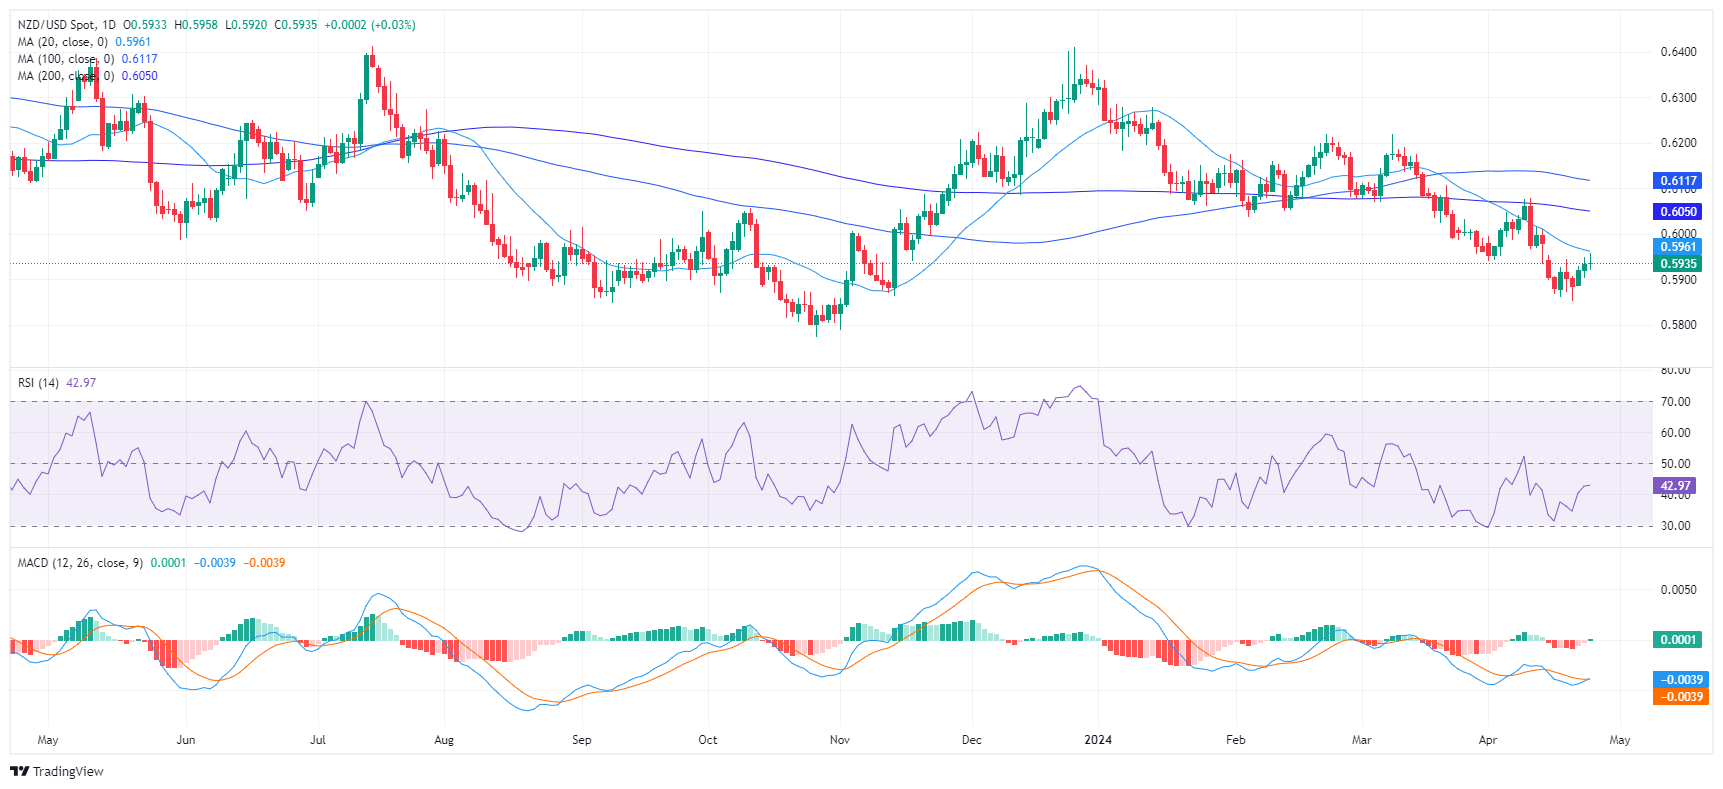
The NZD/USD rose to 0.5937 on Wednesday’s session, presenting subtle gains. Long-term bearish forces maintain overall control of the pair's course. However, there are signals that the bulls may be waking up and as sellers lose traction, it might be the buyer's turn now.

The daily chart Relative Strength Index (RSI) languishes in negative territory. However, an uptick suggests a potential minor correction following many days of depressed readings. The Moving Average Convergence Divergence (MACD) reveals a fresh green bar, signaling that positive momentum is starting to build, albeit the prevailing trend remains bearish.

NZD/USD daily chart
Zooming in, the hourly RSI readings display more fluctuations, swinging between the 40 and 55 marks within Wednesday's timeframe. Furthermore, the hourly MACD shows decreasing red bars, indicating a decline in the pair's downward momentum on this shorter-term chart.

NZD/USD hourly chart
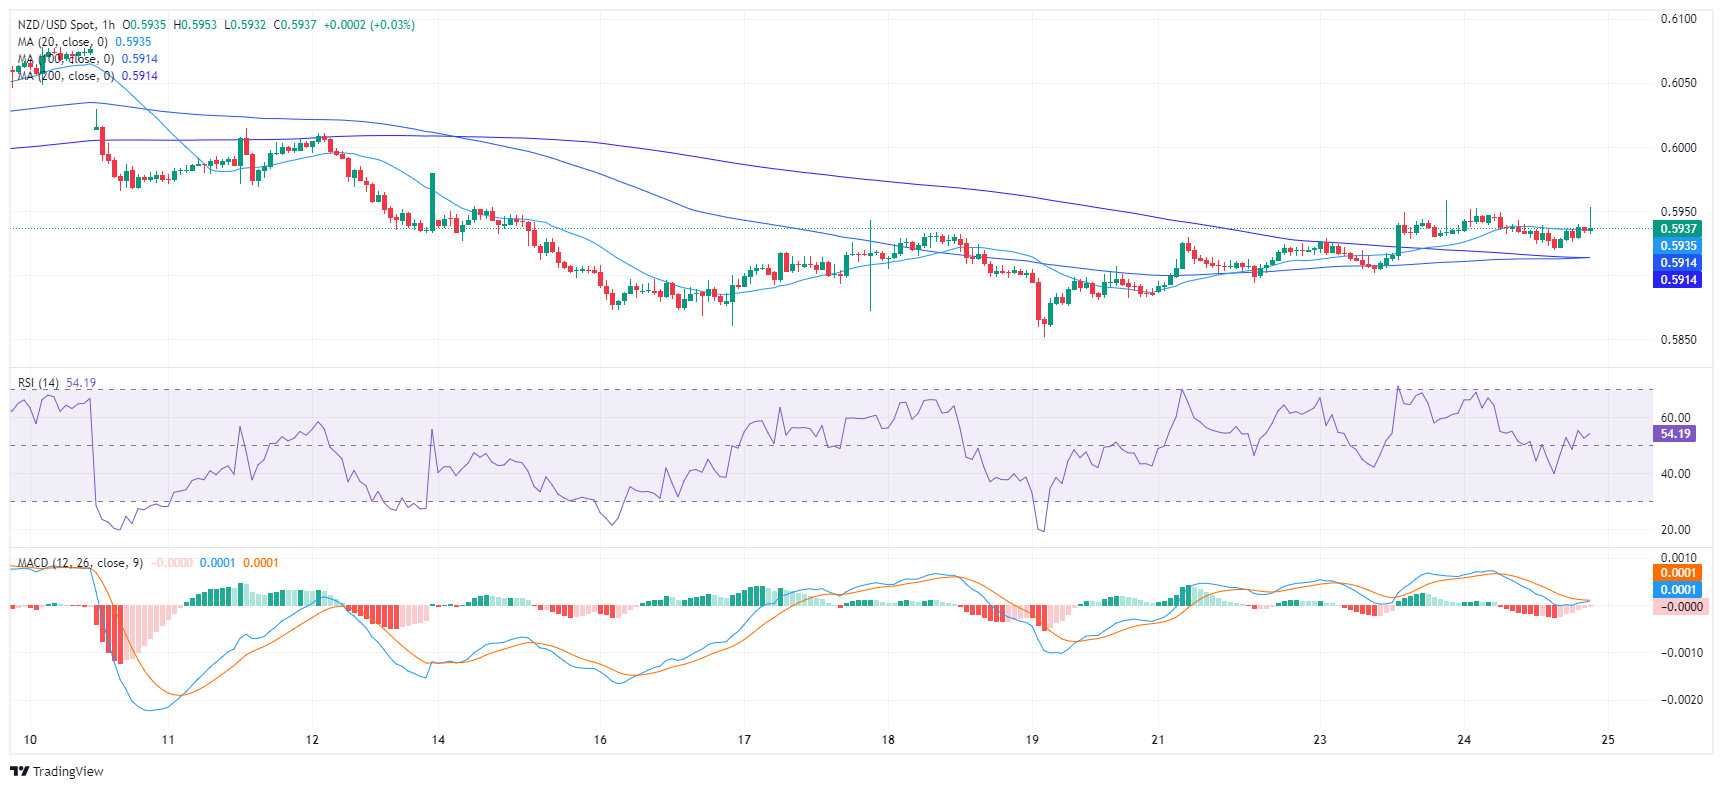
Taking a broader view, the NZD/USD has stayed below its 20, 100, and 200-day Simple Moving Averages (SMAs). This positioning below the SMAs reveals a bearish trend prevailing in short- and long-term frames. Wednesday's rejection of buyers at 0.5960, at the 20-day SMA, reinforces the dominance of sellers in the market and suggests that the downward trend may continue. This situation implies that the current buying momentum isn’t strong enough to be considered a bullish signal. However, the tables would change if the buyers manage to conquer that level in the next sessions.


NZD/USD

Overview
Today last price 0.5936
Today Daily Change 0.0003
Today Daily Change % 0.05
Today daily open 0.5933
 
Trends
Daily SMA20 0.5965
Daily SMA50 0.6055
Daily SMA100 0.6119
Daily SMA200 0.6051
 
Levels
Previous Daily High 0.5949
Previous Daily Low 0.5902
Previous Weekly High 0.5954
Previous Weekly Low 0.5851
Previous Monthly High 0.6218
Previous Monthly Low 0.5956
Daily Fibonacci 38.2% 0.5931
Daily Fibonacci 61.8% 0.592
Daily Pivot Point S1 0.5907
Daily Pivot Point S2 0.5881
Daily Pivot Point S3 0.586
Daily Pivot Point R1 0.5954
Daily Pivot Point R2 0.5975
Daily Pivot Point R3 0.6001


South Korea BOK Manufacturing BSI fell from previous 74 to 71 in May

South Korea BOK Manufacturing BSI fell from previous 74 to 71 in May
Read more Previous

GBP/JPY cracks fresh nine-year high at 193.60

The GBP/JPY broke into a fresh nine-year high above 193.60 on Wednesday as the Pound Sterling (GBP) sees recovery bidding and the Japanese Yen (JPY) continues to weaken despite increasingly interventionist rhetoric from the Bank of Japan (BoJ).
Read more Next