Confirming you are not from the U.S. or the Philippines

By giving this statement, I explicitly declare and confirm that:
  • I am not a U.S. citizen or resident
  • I am not a resident of the Philippines
  • I do not directly or indirectly own more than 10% of shares/voting rights/interest of the U.S. residents and/or do not control U.S. citizens or residents by other means
  • I am not under the direct or indirect ownership of more than 10% of shares/voting rights/interest and/or under the control of U.S. citizen or resident exercised by other means
  • I am not affiliated with U.S. citizens or residents in terms of Section 1504(a) of FATCA
  • I am aware of my liability for making a false declaration.
For the purposes of this statement, all U.S. dependent countries and territories are equalled to the main territory of the USA. I accept full responsibility for the accuracy of this declaration and commit to personally address and resolve any claims or issues that may arise from a breach of this statement.
We are dedicated to your privacy and the security of your personal information. We only collect emails to provide special offers and important information about our products and services. By submitting your email address, you agree to receive such letters from us. If you want to unsubscribe or have any questions or concerns, write to our Customer Support.
Octa trading broker
Open trading account
Back

NZD/JPY Price Analysis: Seller control the short term,overall trend remains bullist

  • The daily RSI reveals that market momentum is currently dominated by sellers.
  • The daily MACD presents flat green bars, indicating a lack of buying traction.
  • In the hourly chart, the RSI shows slight improvement, suggesting sellers losing some ground.

The NZD/JPY stabilized at around 90.94 and managed to clear most of its daily losses. However, in the shorter time frames, there are signs of a bullish recovery.

The daily Relative Strength Index (RSI) hovers in the negative territory. The most recent reading fell to 48, reflecting a market momentum currently dominated by sellers. Furthermore, the Moving Average Convergence Divergence (MACD) histogram prints flat green bars, indicating a lack of positive momentum.
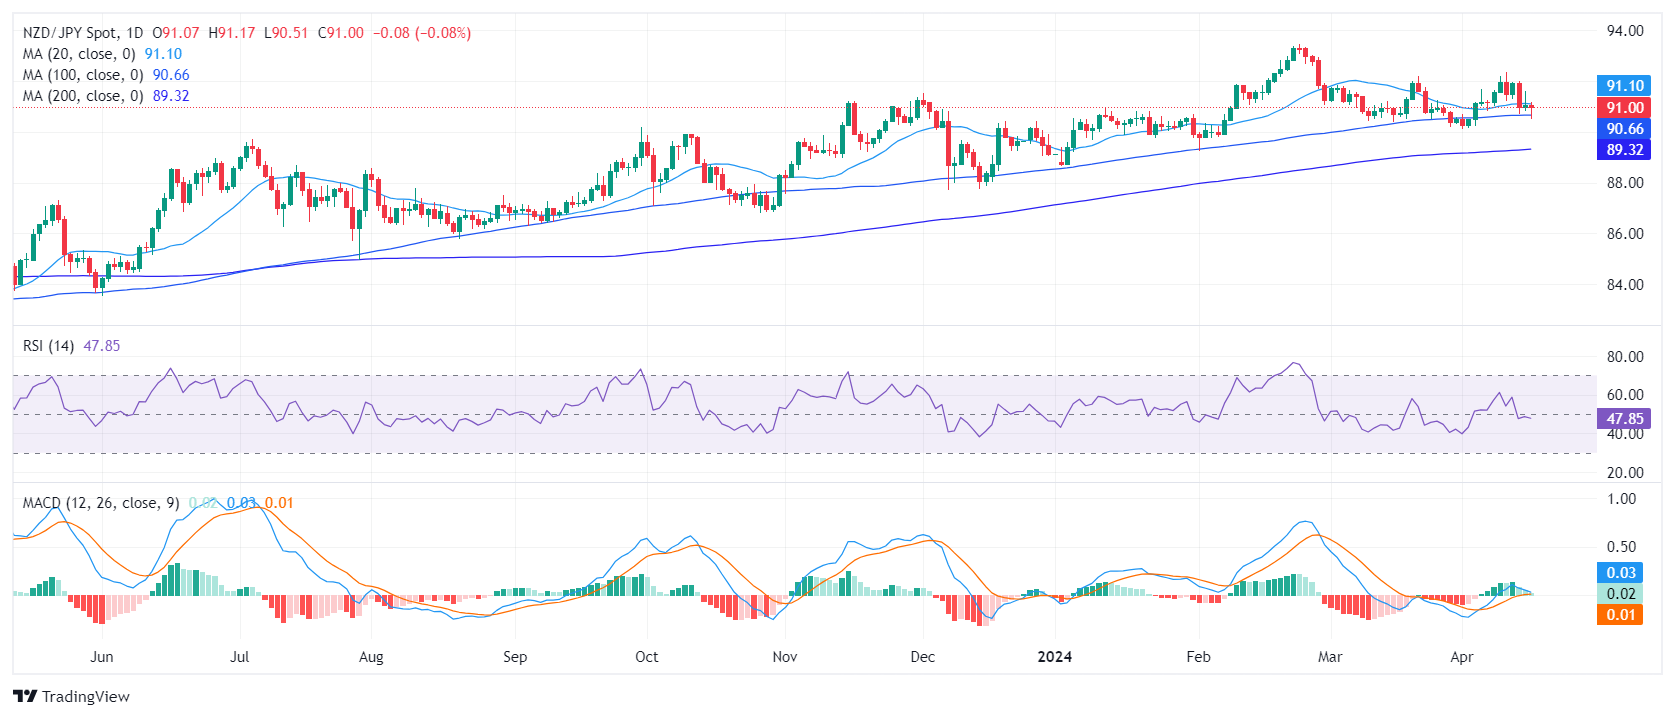
NZD/JPY daily chart

Transitioning to the hourly chart, the RSI seems to confirm the tepid sentiment observed on the daily chart. The most recent reading also lands in the 48 range. Nevertheless, signs of slight improvement towards the positive territory appear in the RSI and the latest session reading climbed from a preceding low of 41. Moreover, the MACD histogram on the hourly chart prints green bars, suggesting a possible pick-up in positive momentum.
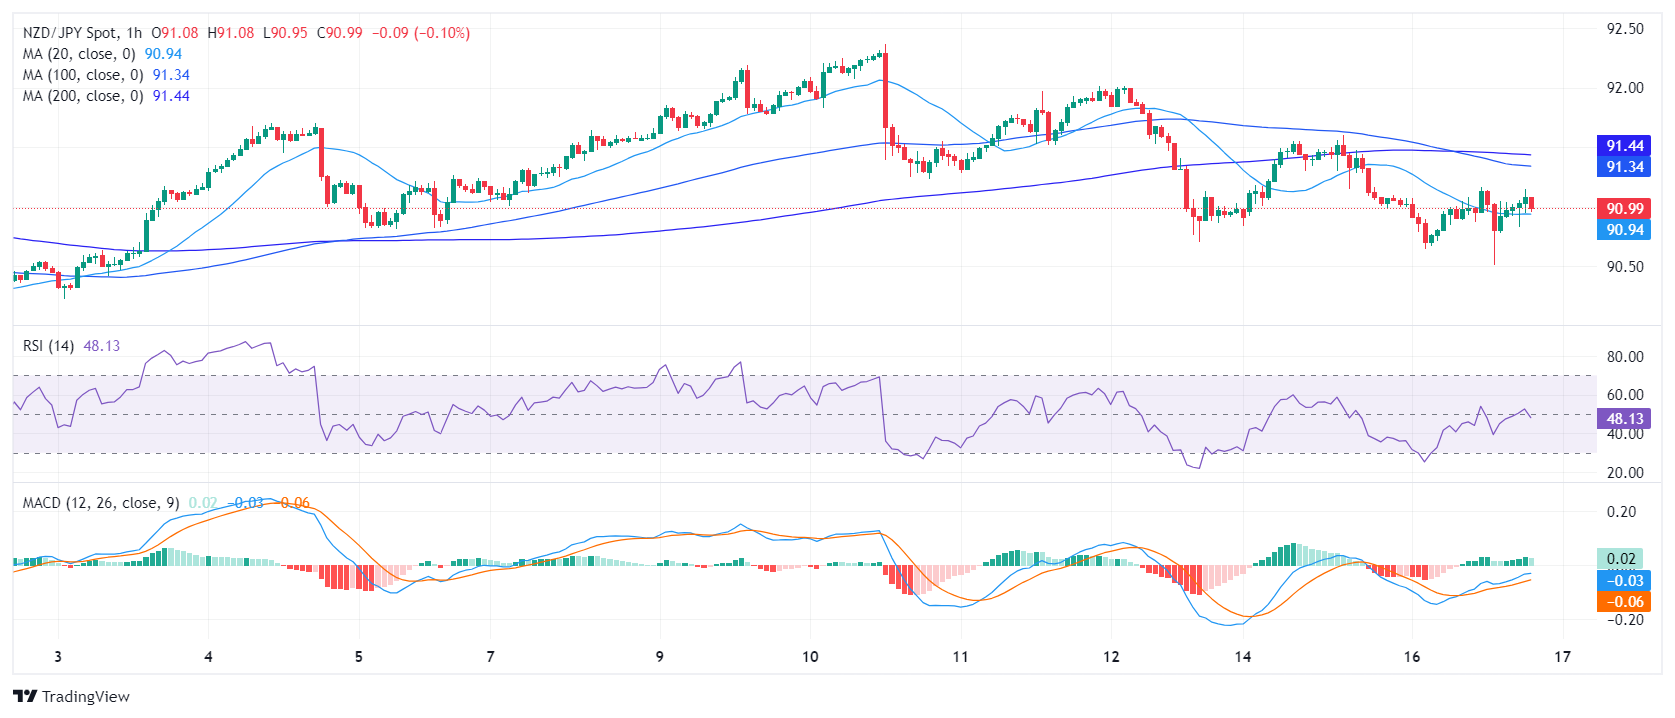
NZD/JPY hourly chart

The broader outlook, on the other hand, suggests that the bulls control the overall trend, but as long as the buyers fail to reclaim the 20-day Simple Moving Average (SMA), the short-term outlook will remain tilted in favor of the buyers.


NZD/JPY

Overview
Today last price 90.98
Today Daily Change -0.09
Today Daily Change % -0.10
Today daily open 91.07
 
Trends
Daily SMA20 91.12
Daily SMA50 91.39
Daily SMA100 90.65
Daily SMA200 89.3
 
Levels
Previous Daily High 91.6
Previous Daily Low 90.84
Previous Weekly High 92.37
Previous Weekly Low 90.7
Previous Monthly High 92.2
Previous Monthly Low 90.17
Daily Fibonacci 38.2% 91.31
Daily Fibonacci 61.8% 91.13
Daily Pivot Point S1 90.74
Daily Pivot Point S2 90.4
Daily Pivot Point S3 89.97
Daily Pivot Point R1 91.51
Daily Pivot Point R2 91.94
Daily Pivot Point R3 92.27


Gold price rises amid Fed Powell’s comments, Middle East tensions

Gold prices edged higher late in Tuesday’s North American session, gaining 0.22% following a hawkish tilt by Federal Reserve Chair Jerome Powell.
Read more Previous

Silver Price Analysis: XAG/USD pulls back as dark cloud cover loom

Silver prices retreat from daily highs reached $29.01, dropping 2.63%, affected by high US Treasury yields, and stirring resistance around the $29.00 threshold.
Read more Next